
Dashboard and e-commerce

Smartlife Domotica
Management dashboard with turnover, margin, inventory and marketing. With links to the sales channels.
View Smartlife DomoticaThe numbers and information you need in one place. For management, e-commerce or daily planning.
A dashboard can be a report, but also a working environment in which you look up data, check deviations and maintain files.
We bring together as many relevant sources as possible: sales data from web shops, marketplaces or your cash register, purchasing data from your ERP or accounting and stock from your warehouse system. Returns, shipping costs, advertising data, CRM and time registrations can also supplement the picture. We automatically retrieve this data via API links, so that you do not have to keep supplying separate files.
Sales data shows what you convert. When purchasing prices, returns and sales costs are added, it becomes clearer what remains. Stock, outstanding orders and delivery times then help you plan ahead.
The more reliable, relevant data we connect, the more complete the dashboard becomes. More data especially helps if the data is current and has the same meaning.
At the start-up, we determine which data are essential for each insight. We retrieve the available history via APIs, connect items and orders and check double counting, missing fields and totals with the source systems.
We agree how often the API links automatically update the figures and make it visible when data is missing or outdated. Only during a temporary test during the start-up can we use an import file to show the operation. The data is then retrieved via the agreed API connections.
View essential data and processing per module →Read how we retrieve data via APIs →More about data quality →
Check out the mobile and desktop views. Scroll through the screens or tap an image to enlarge it.
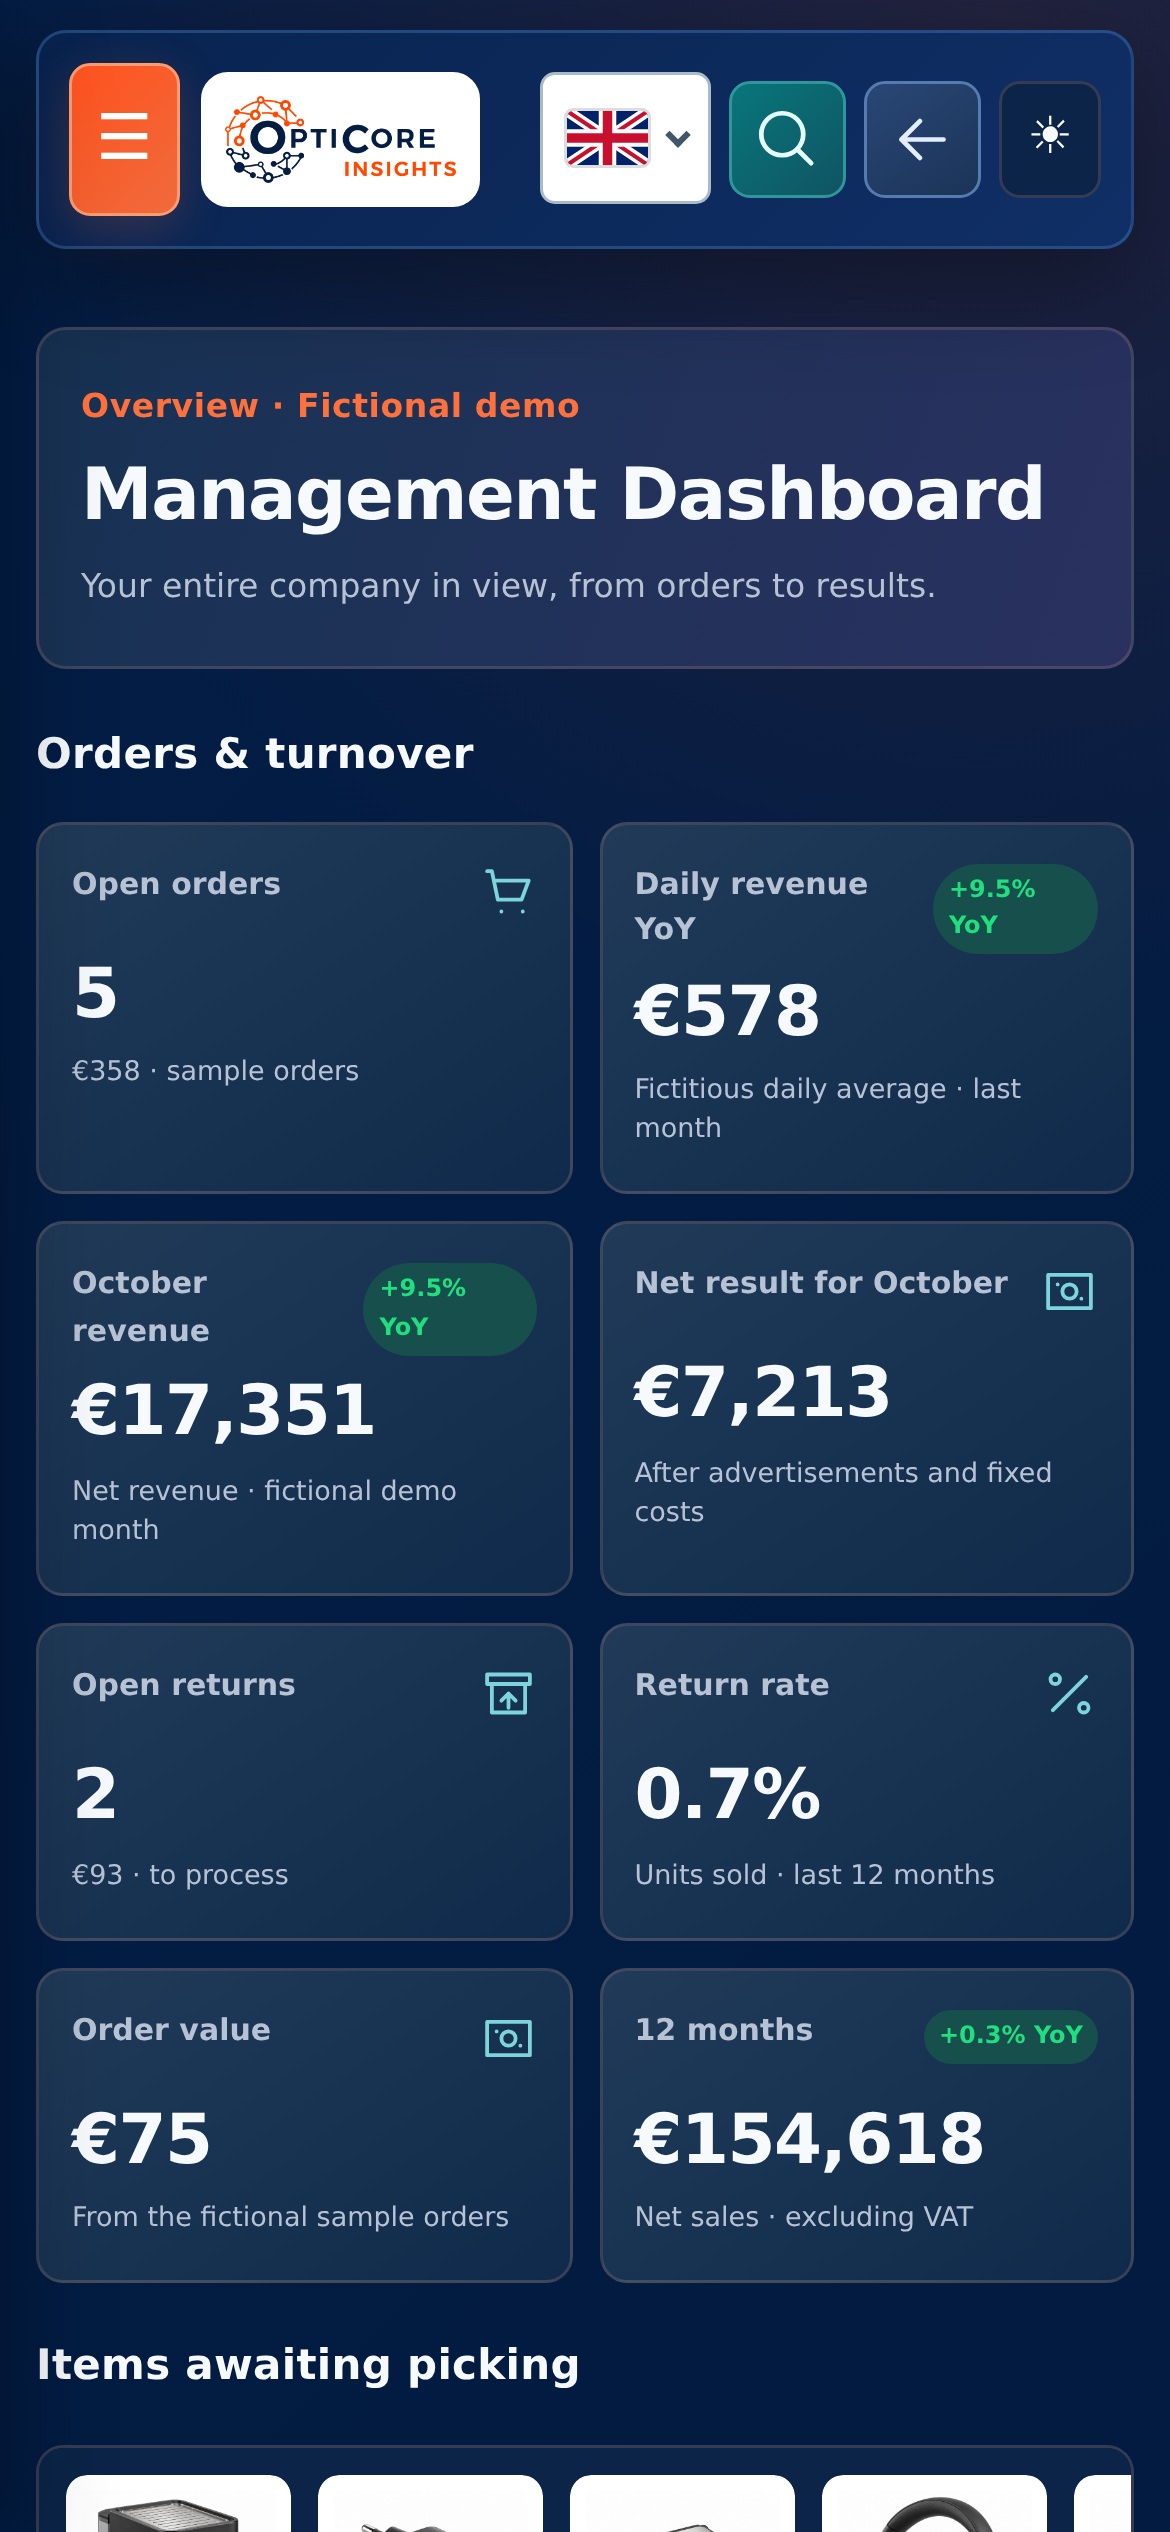
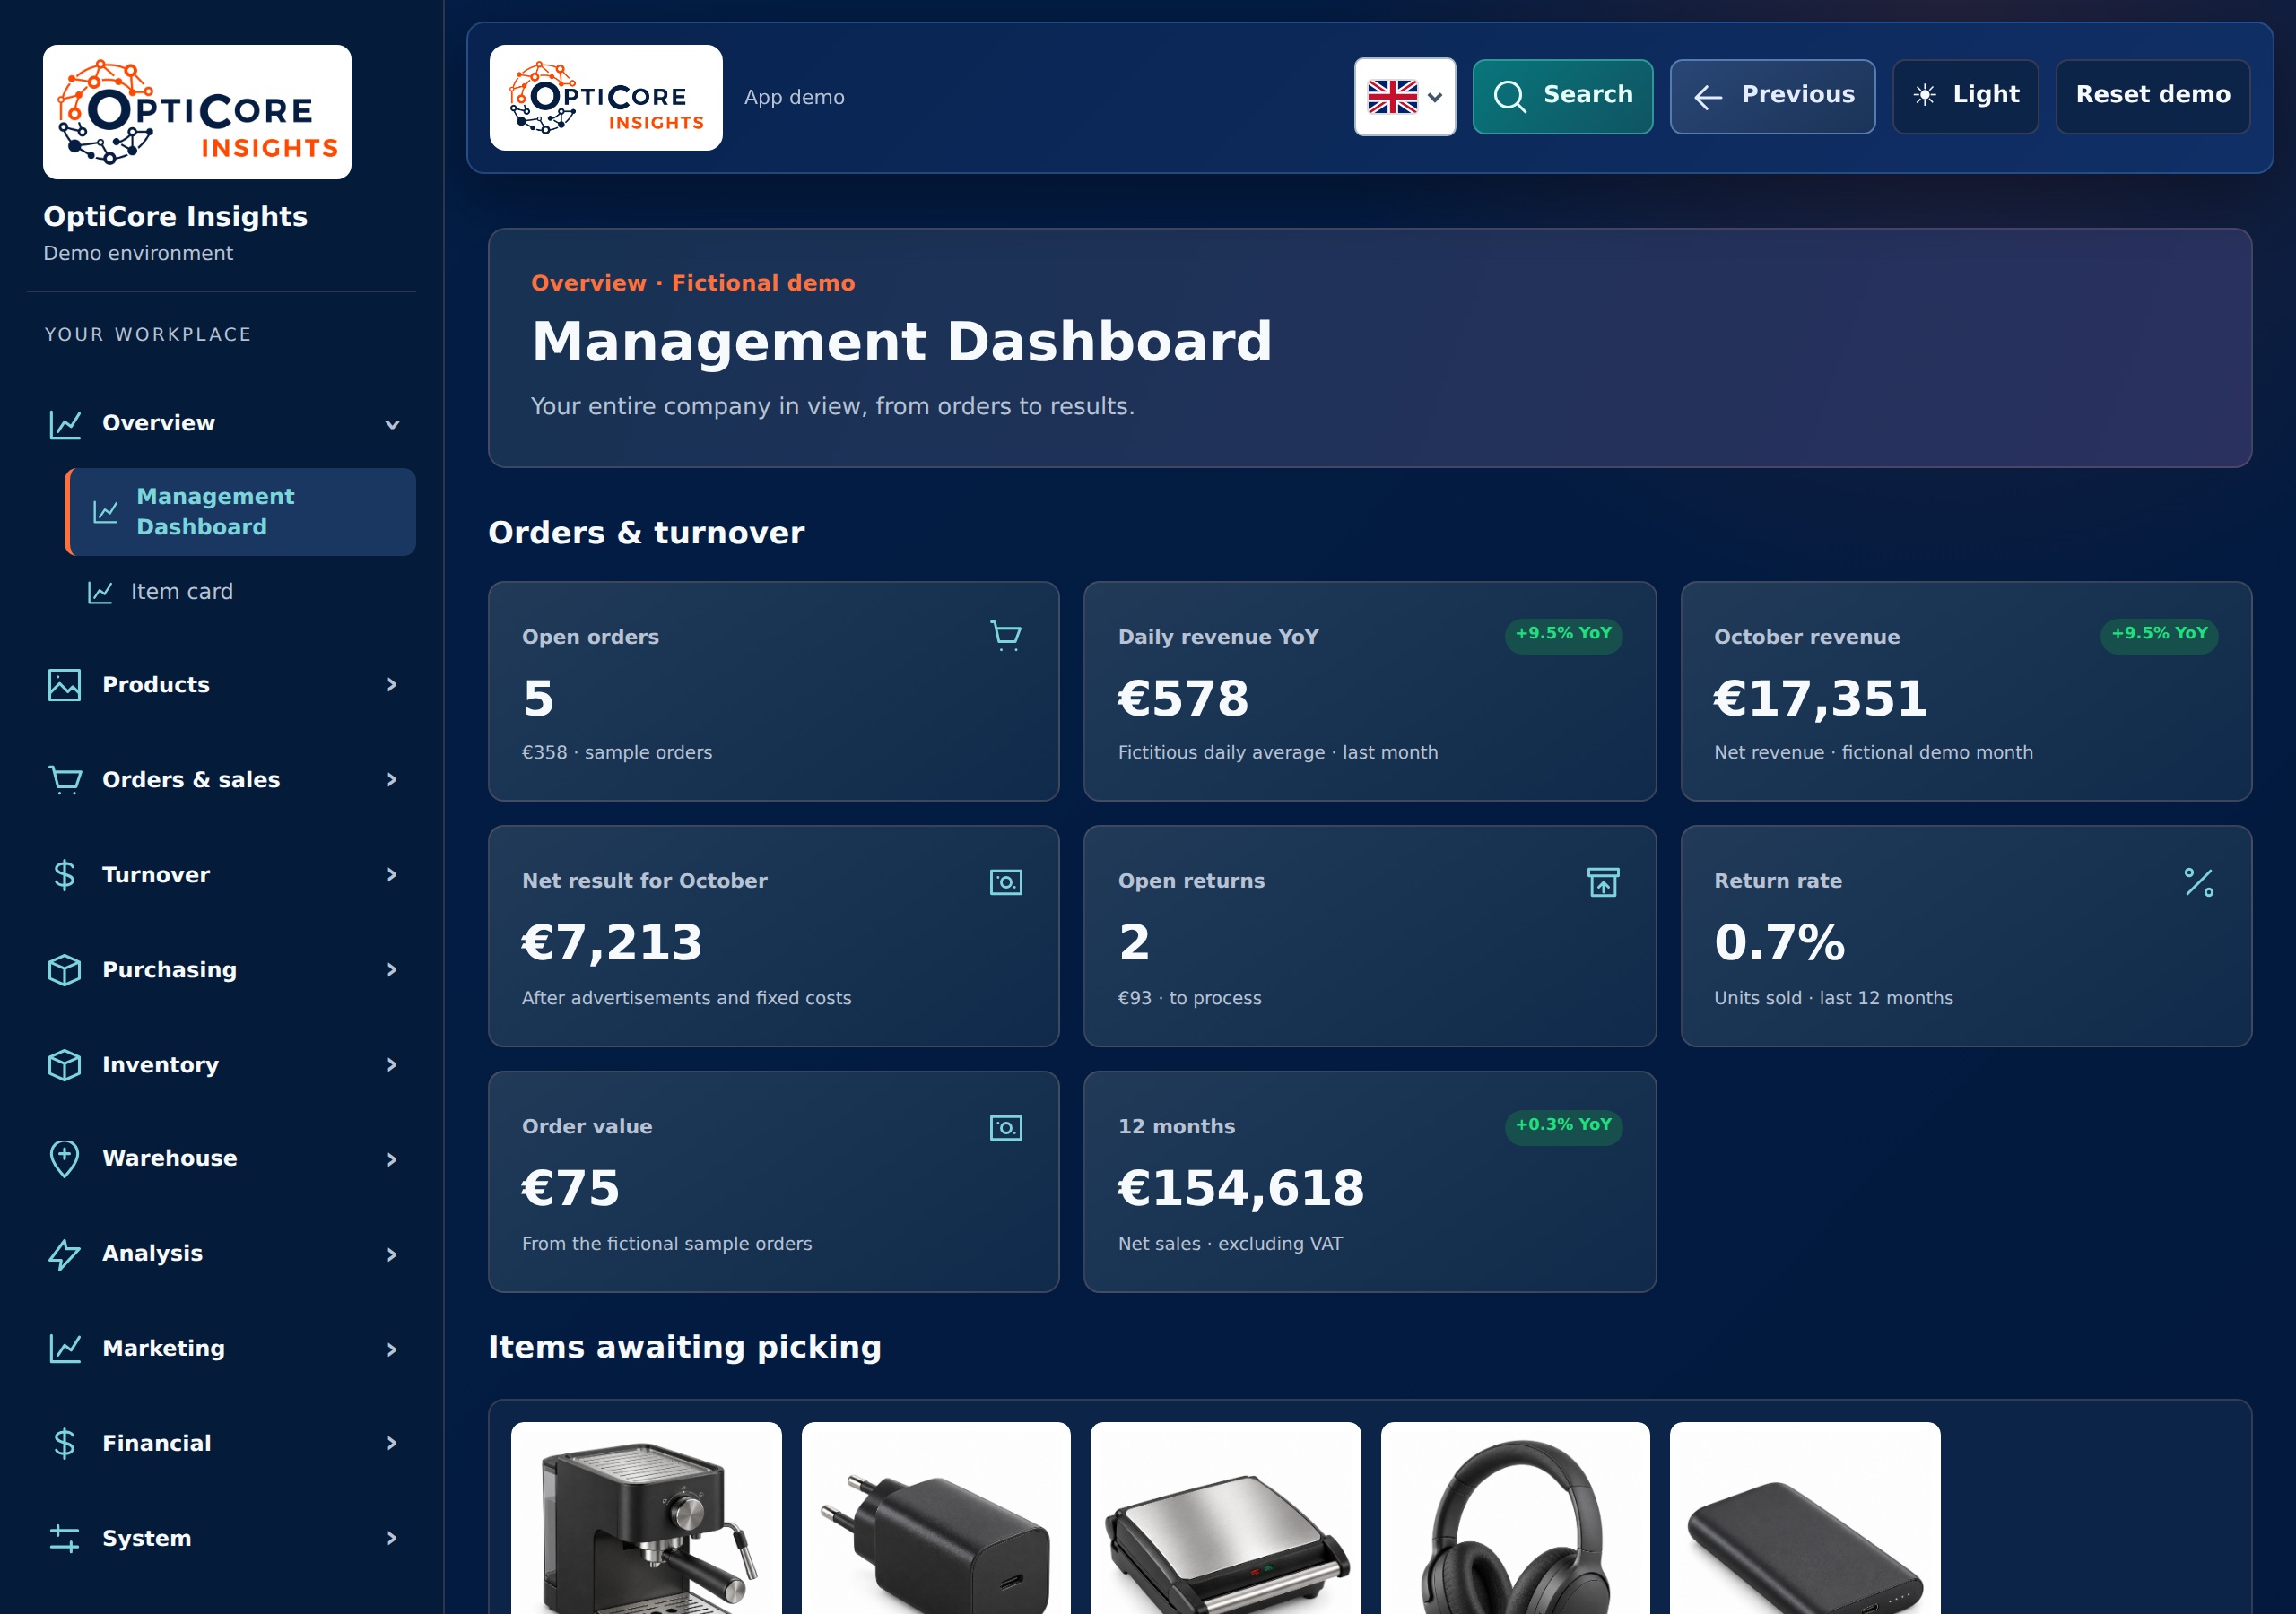
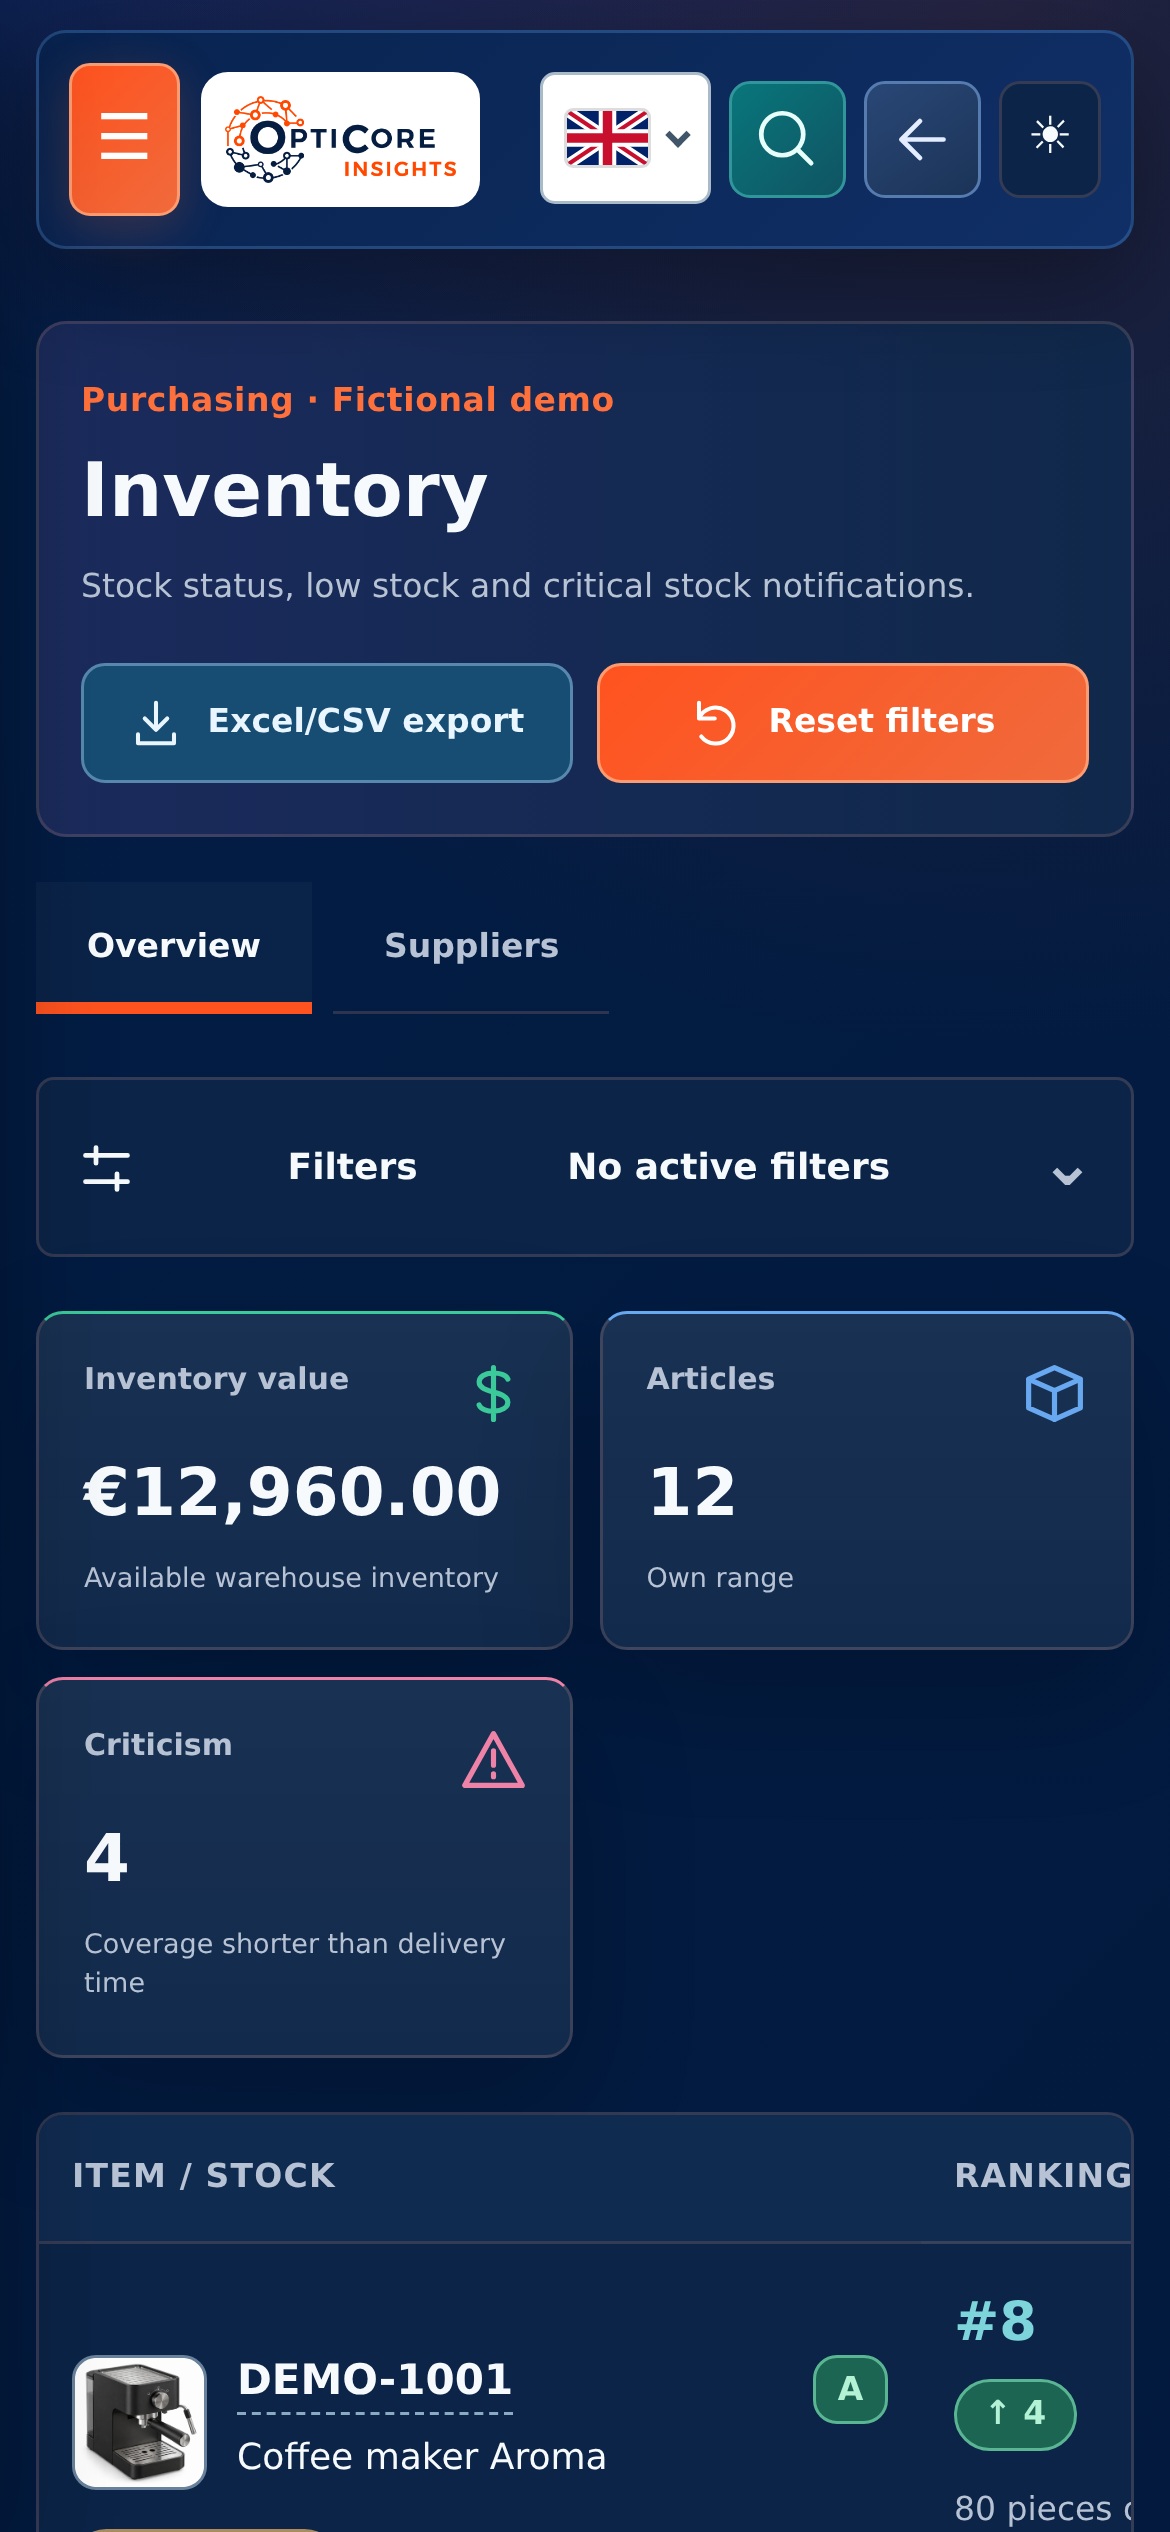
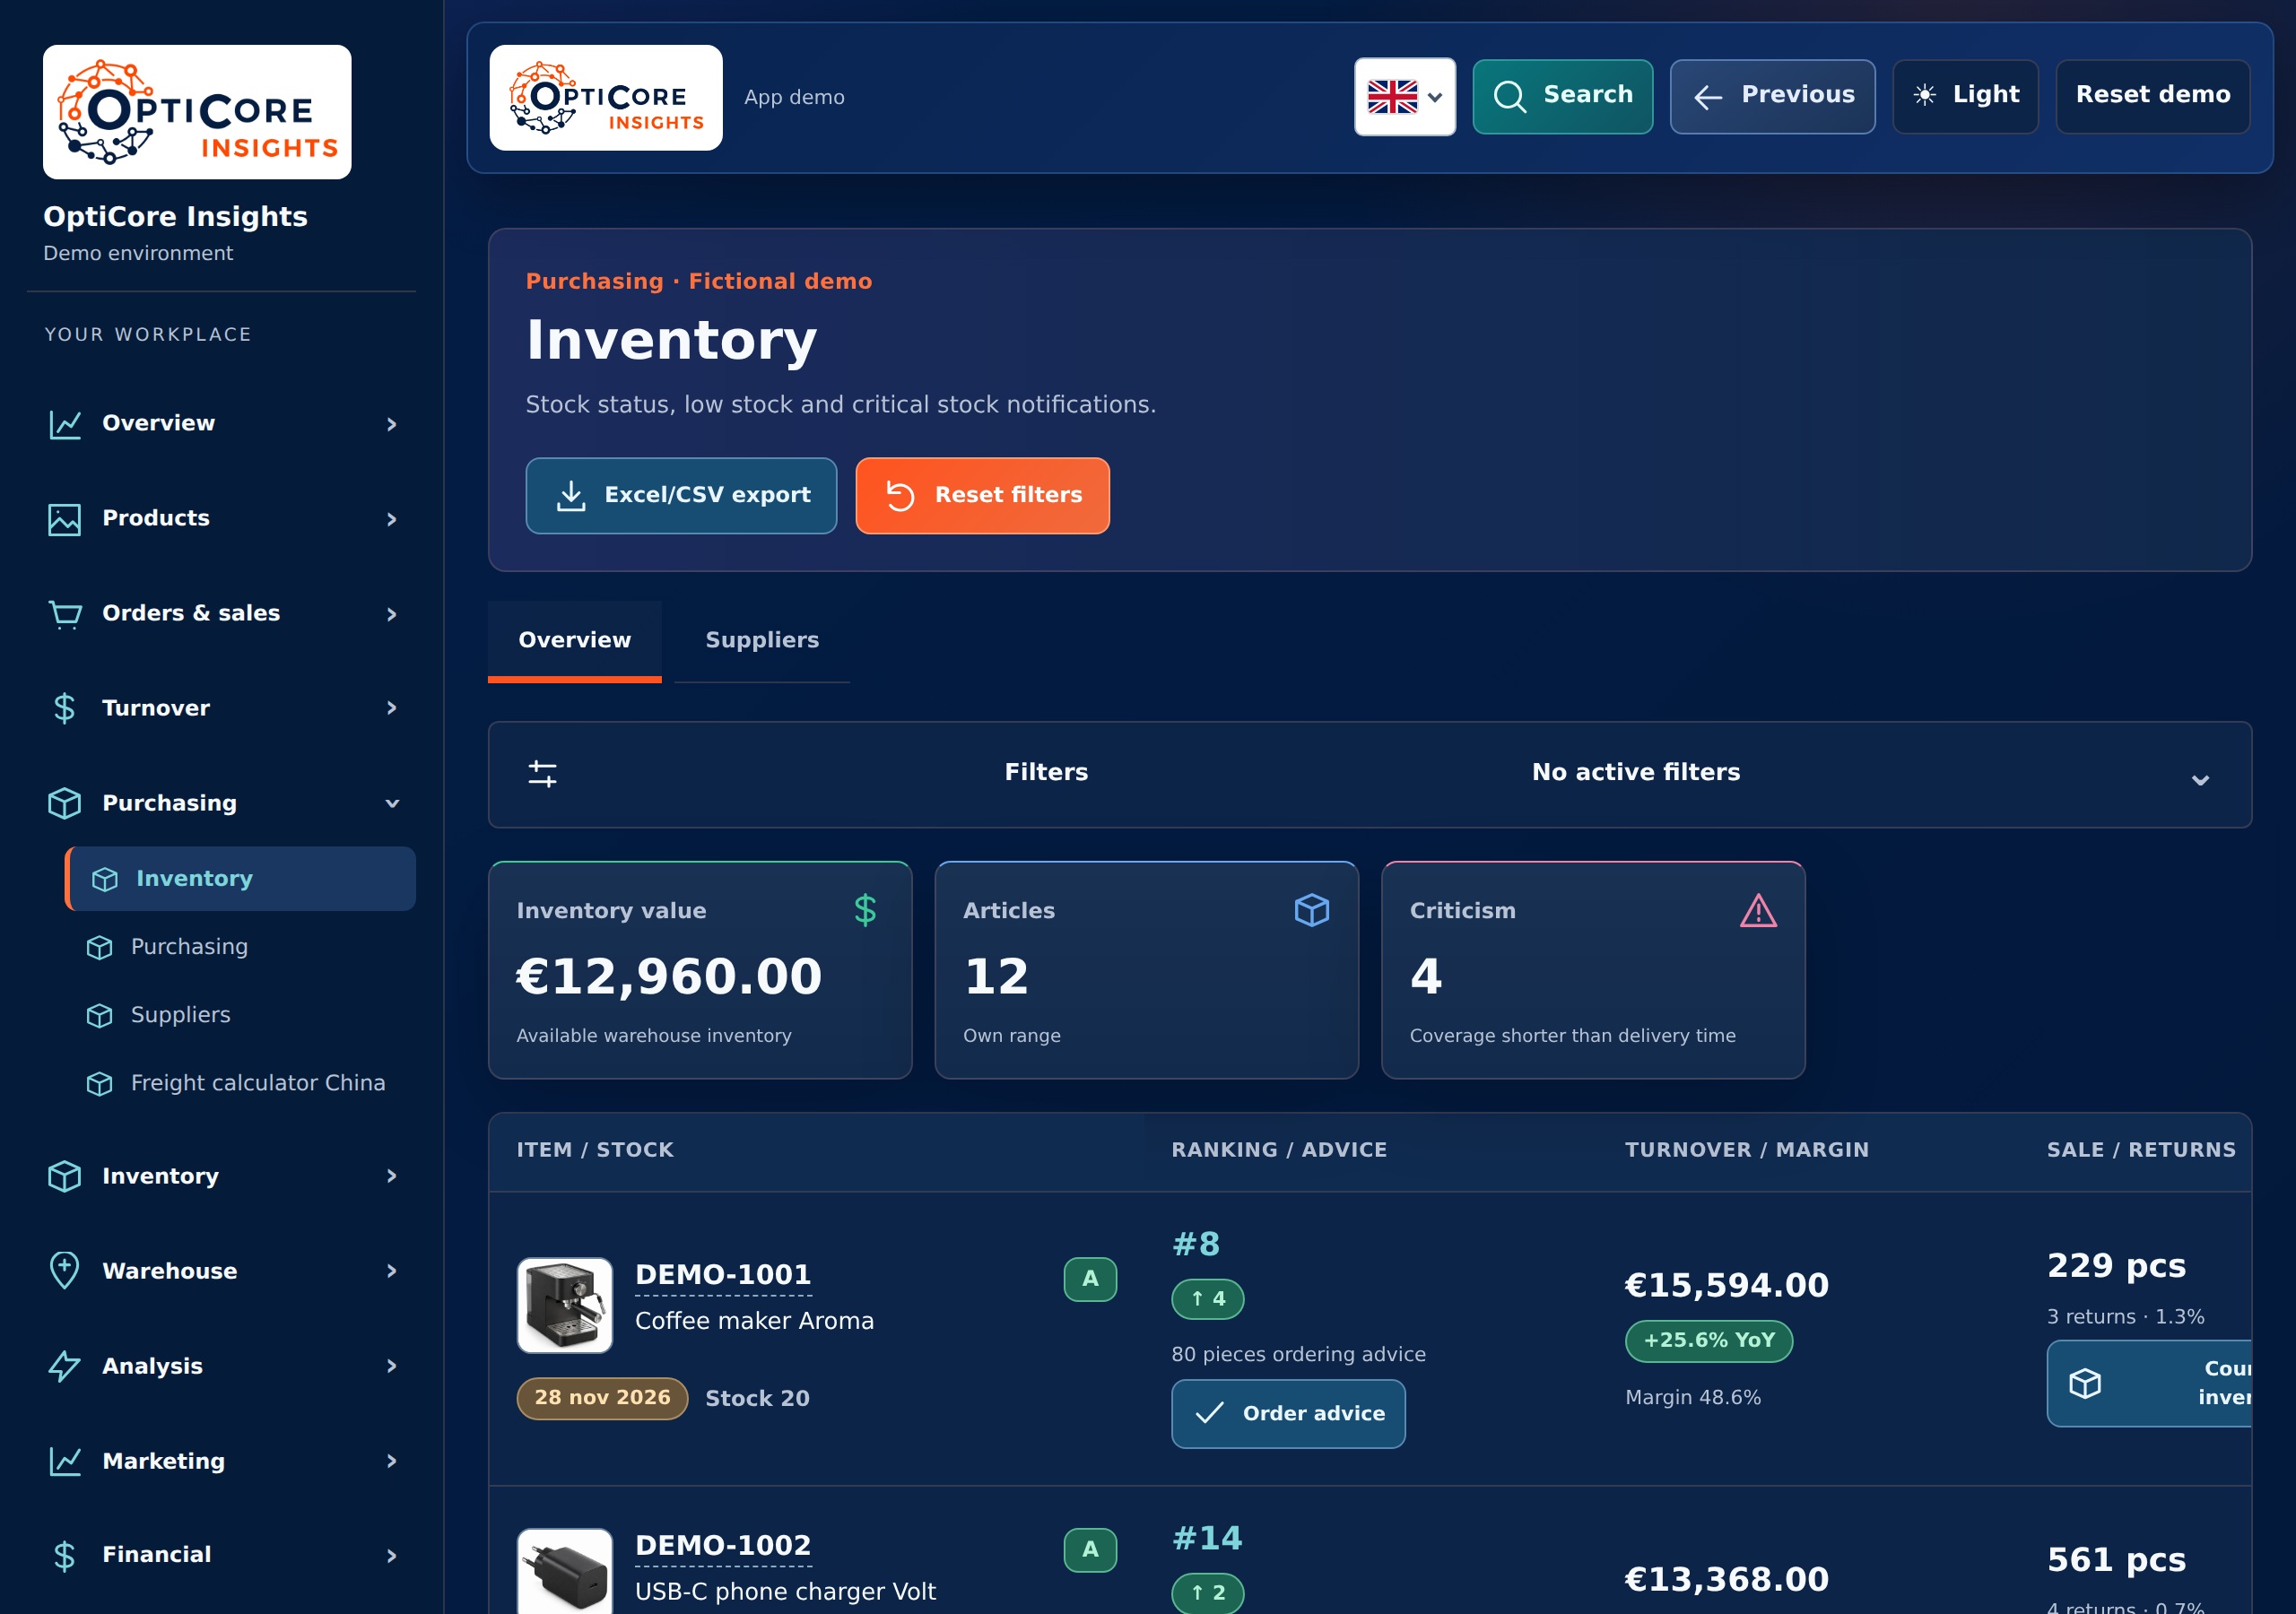
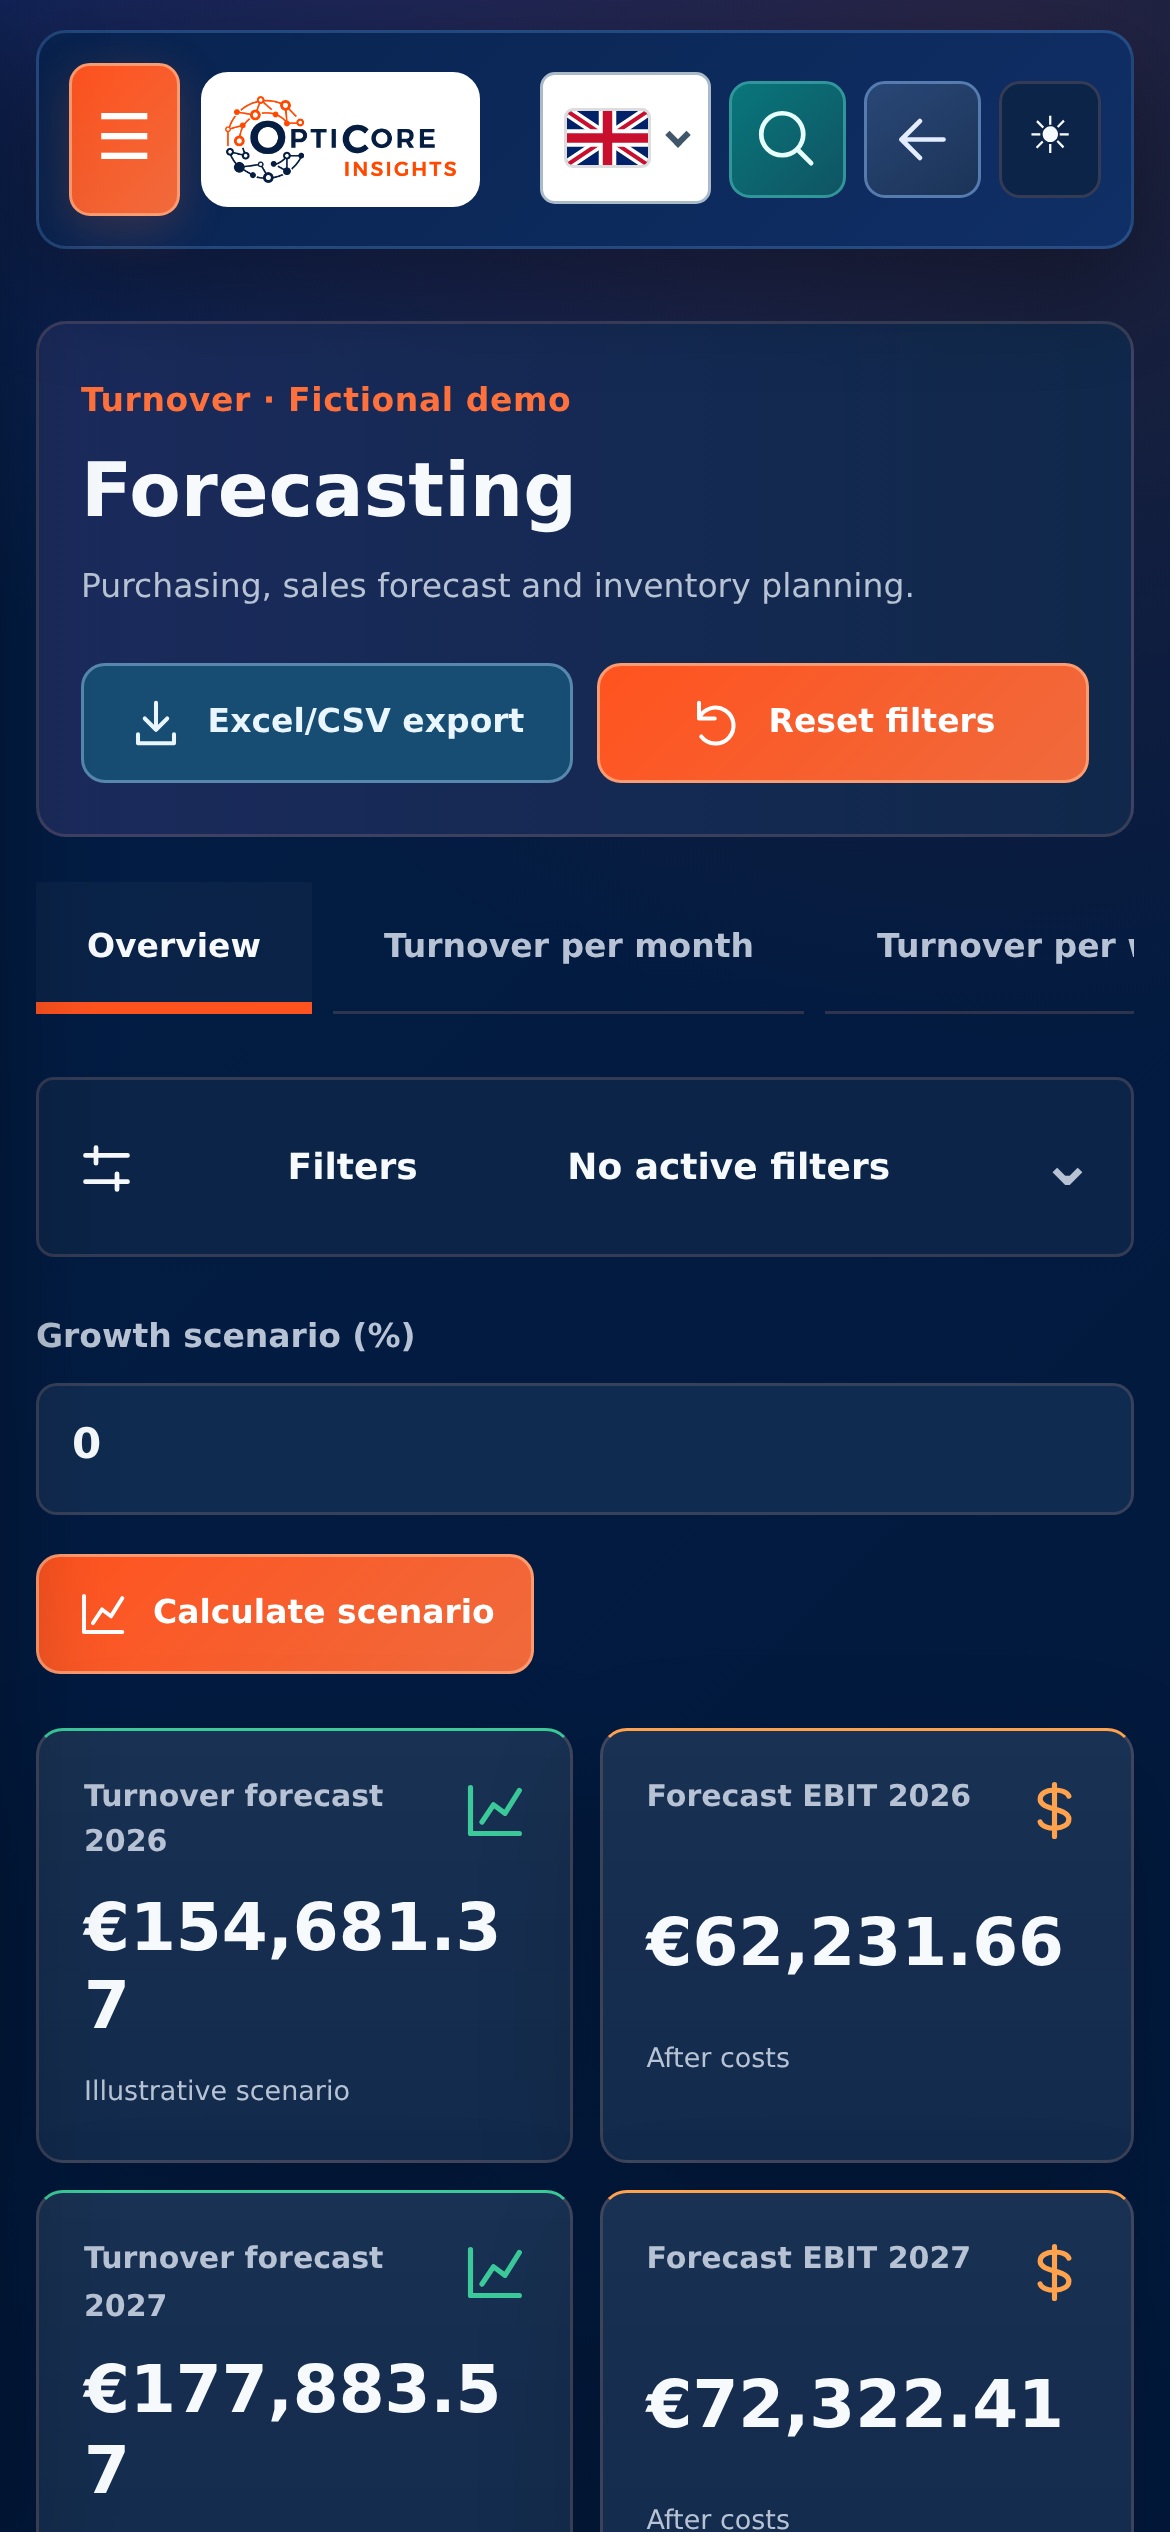
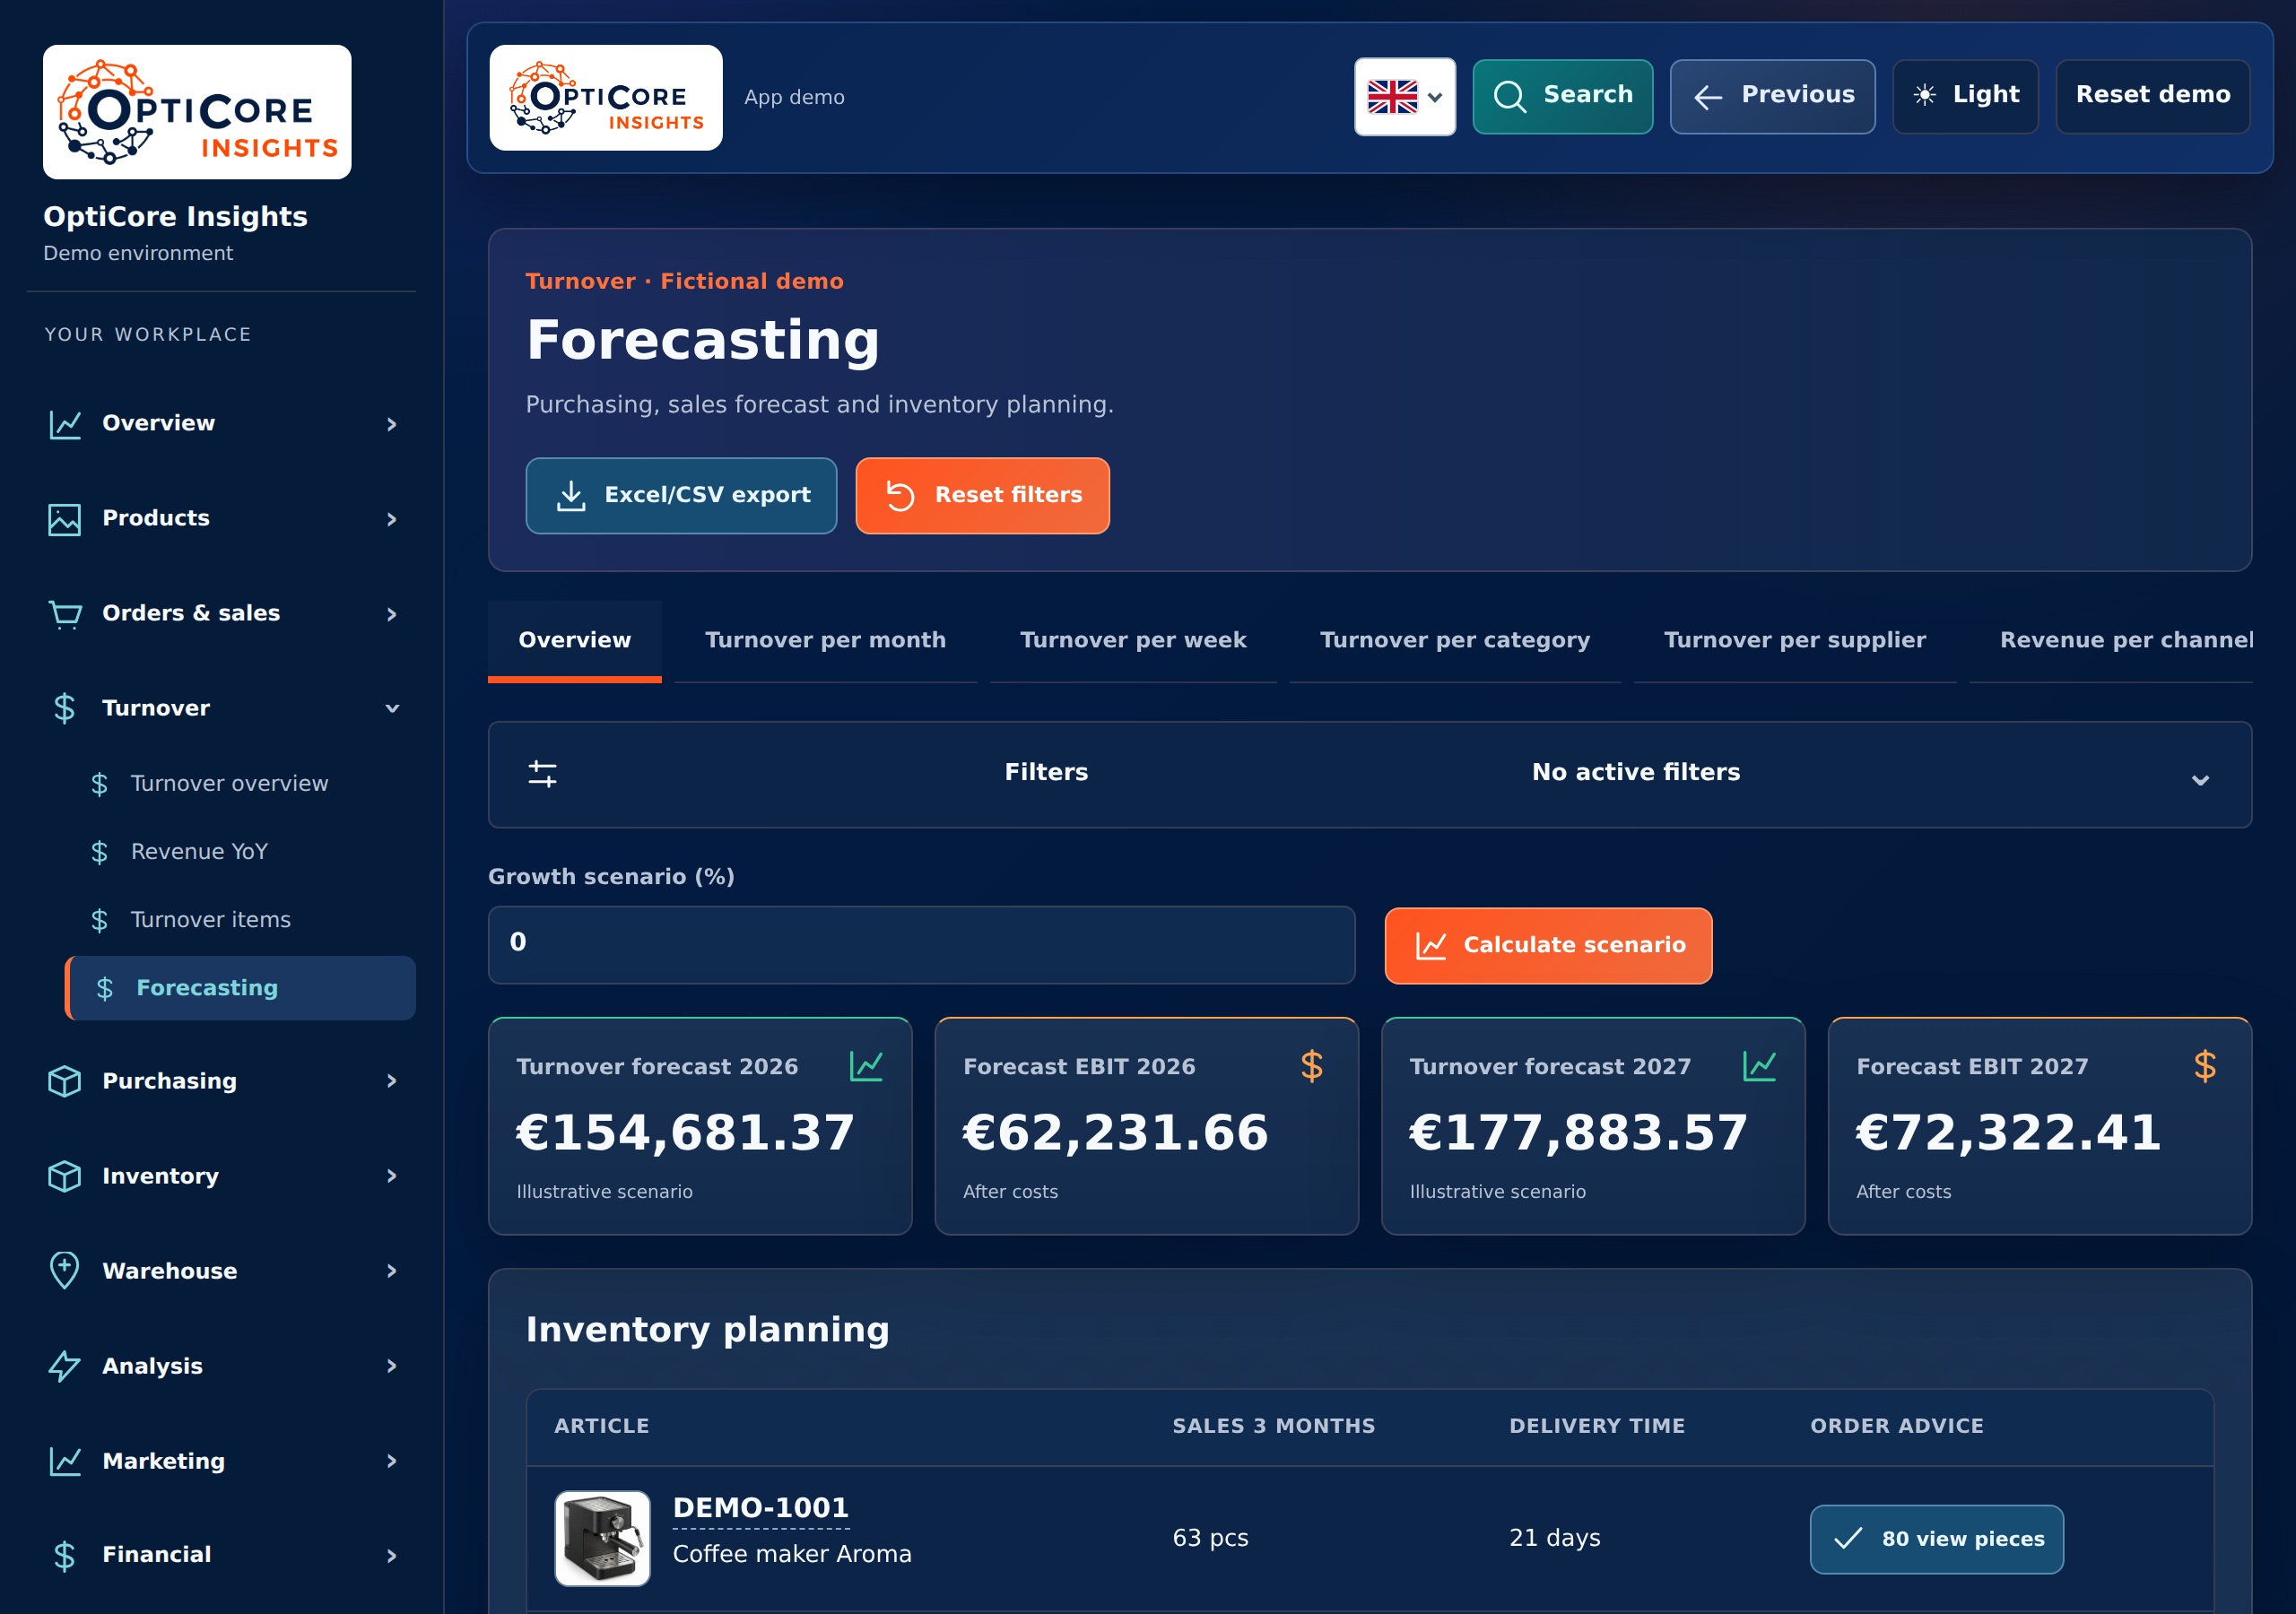
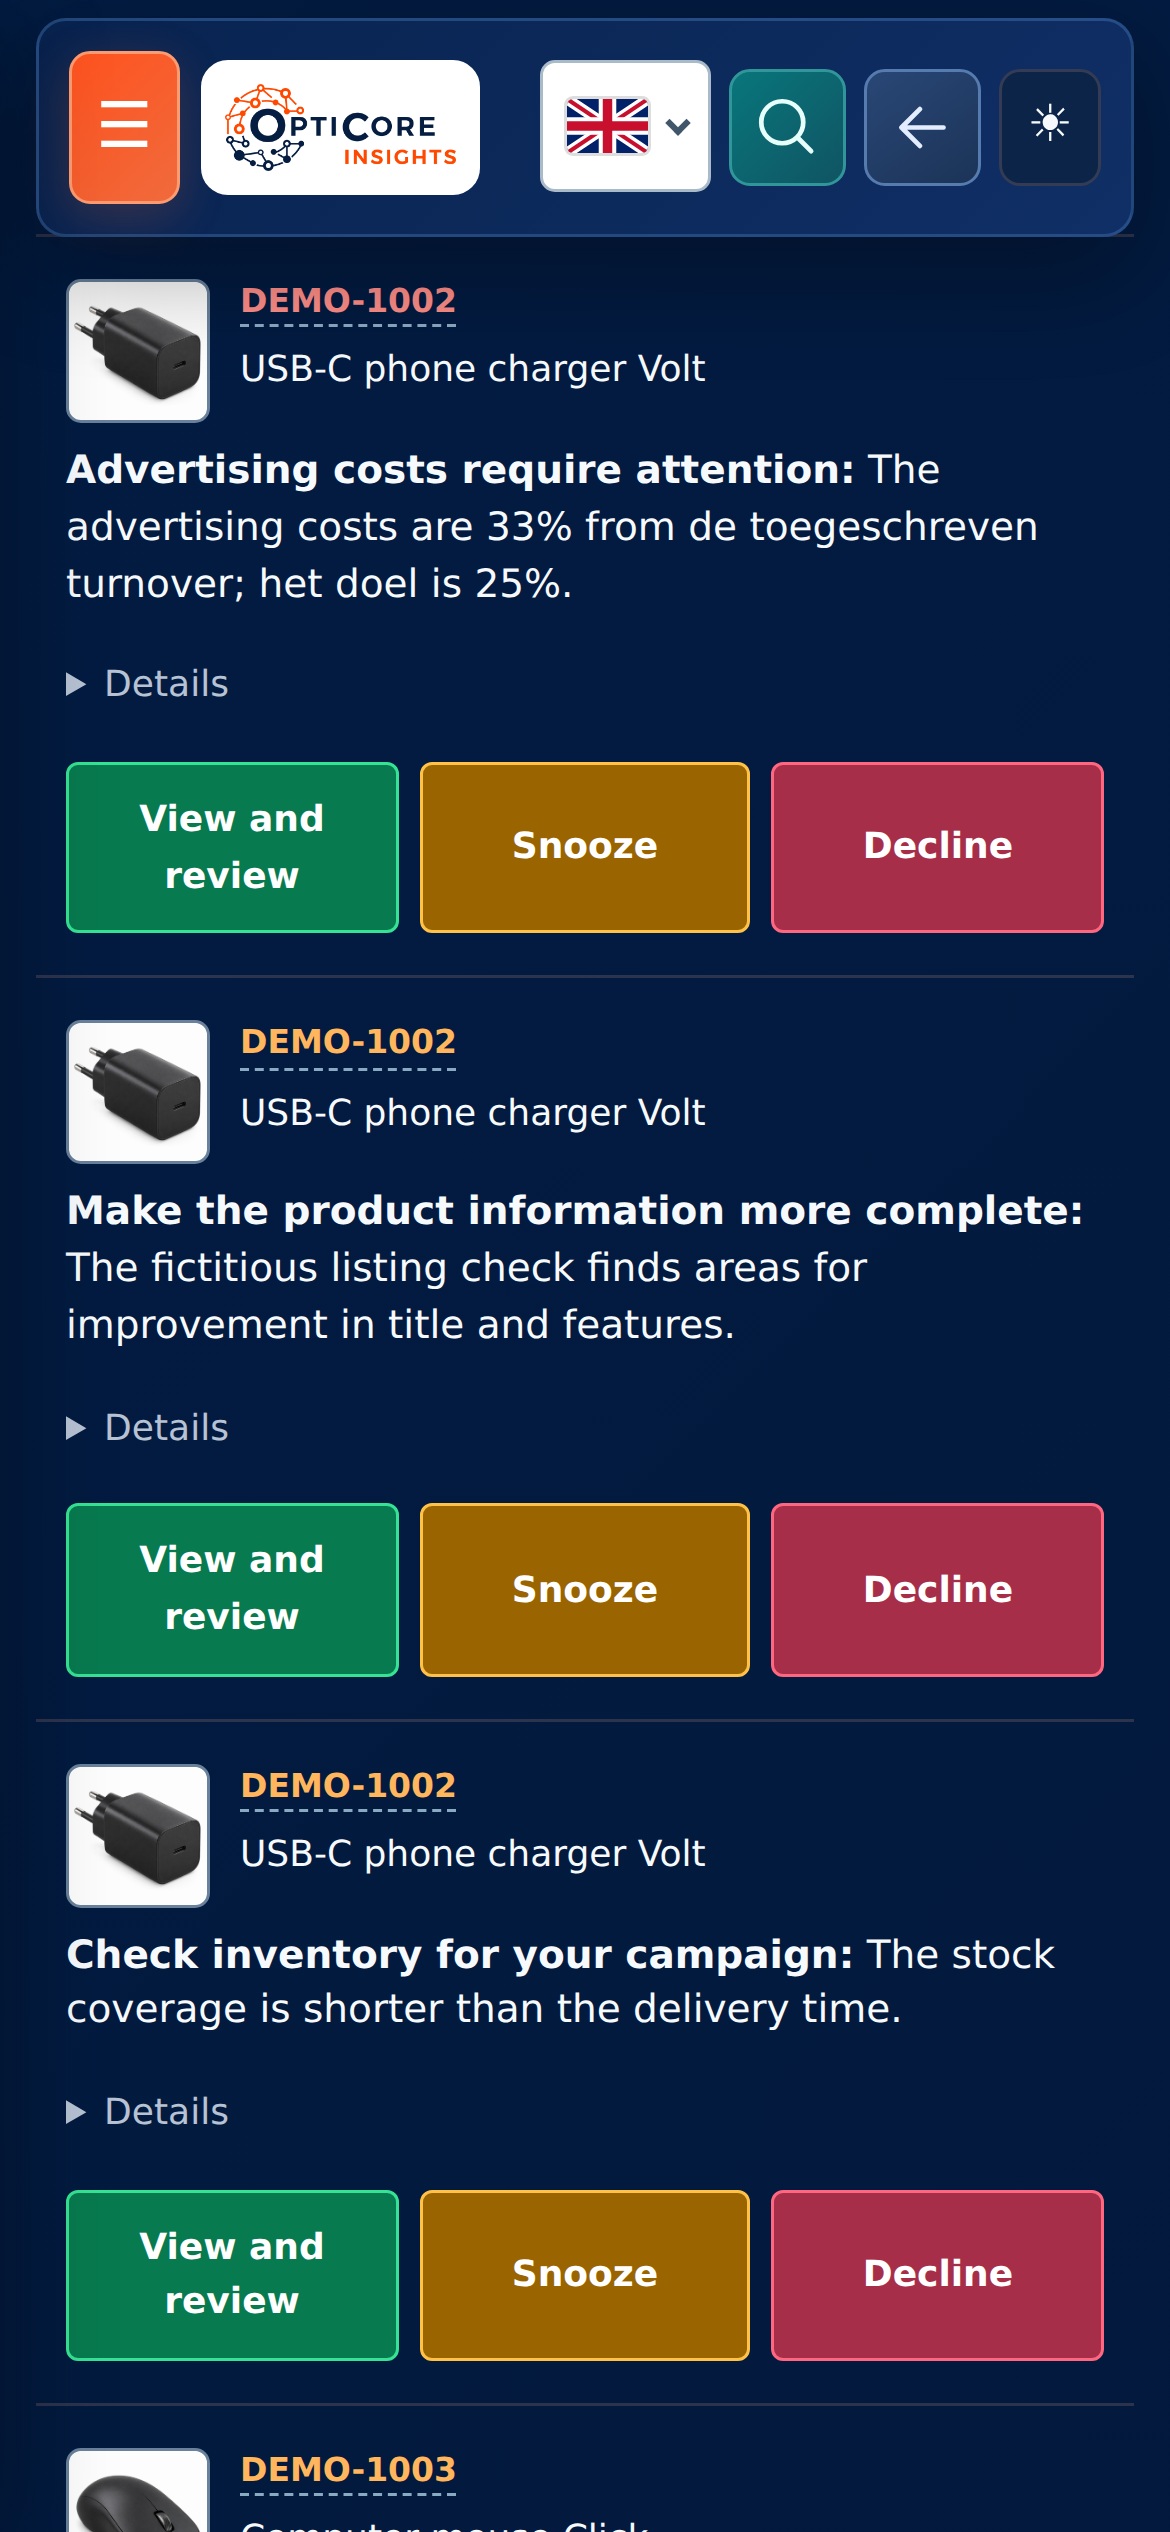
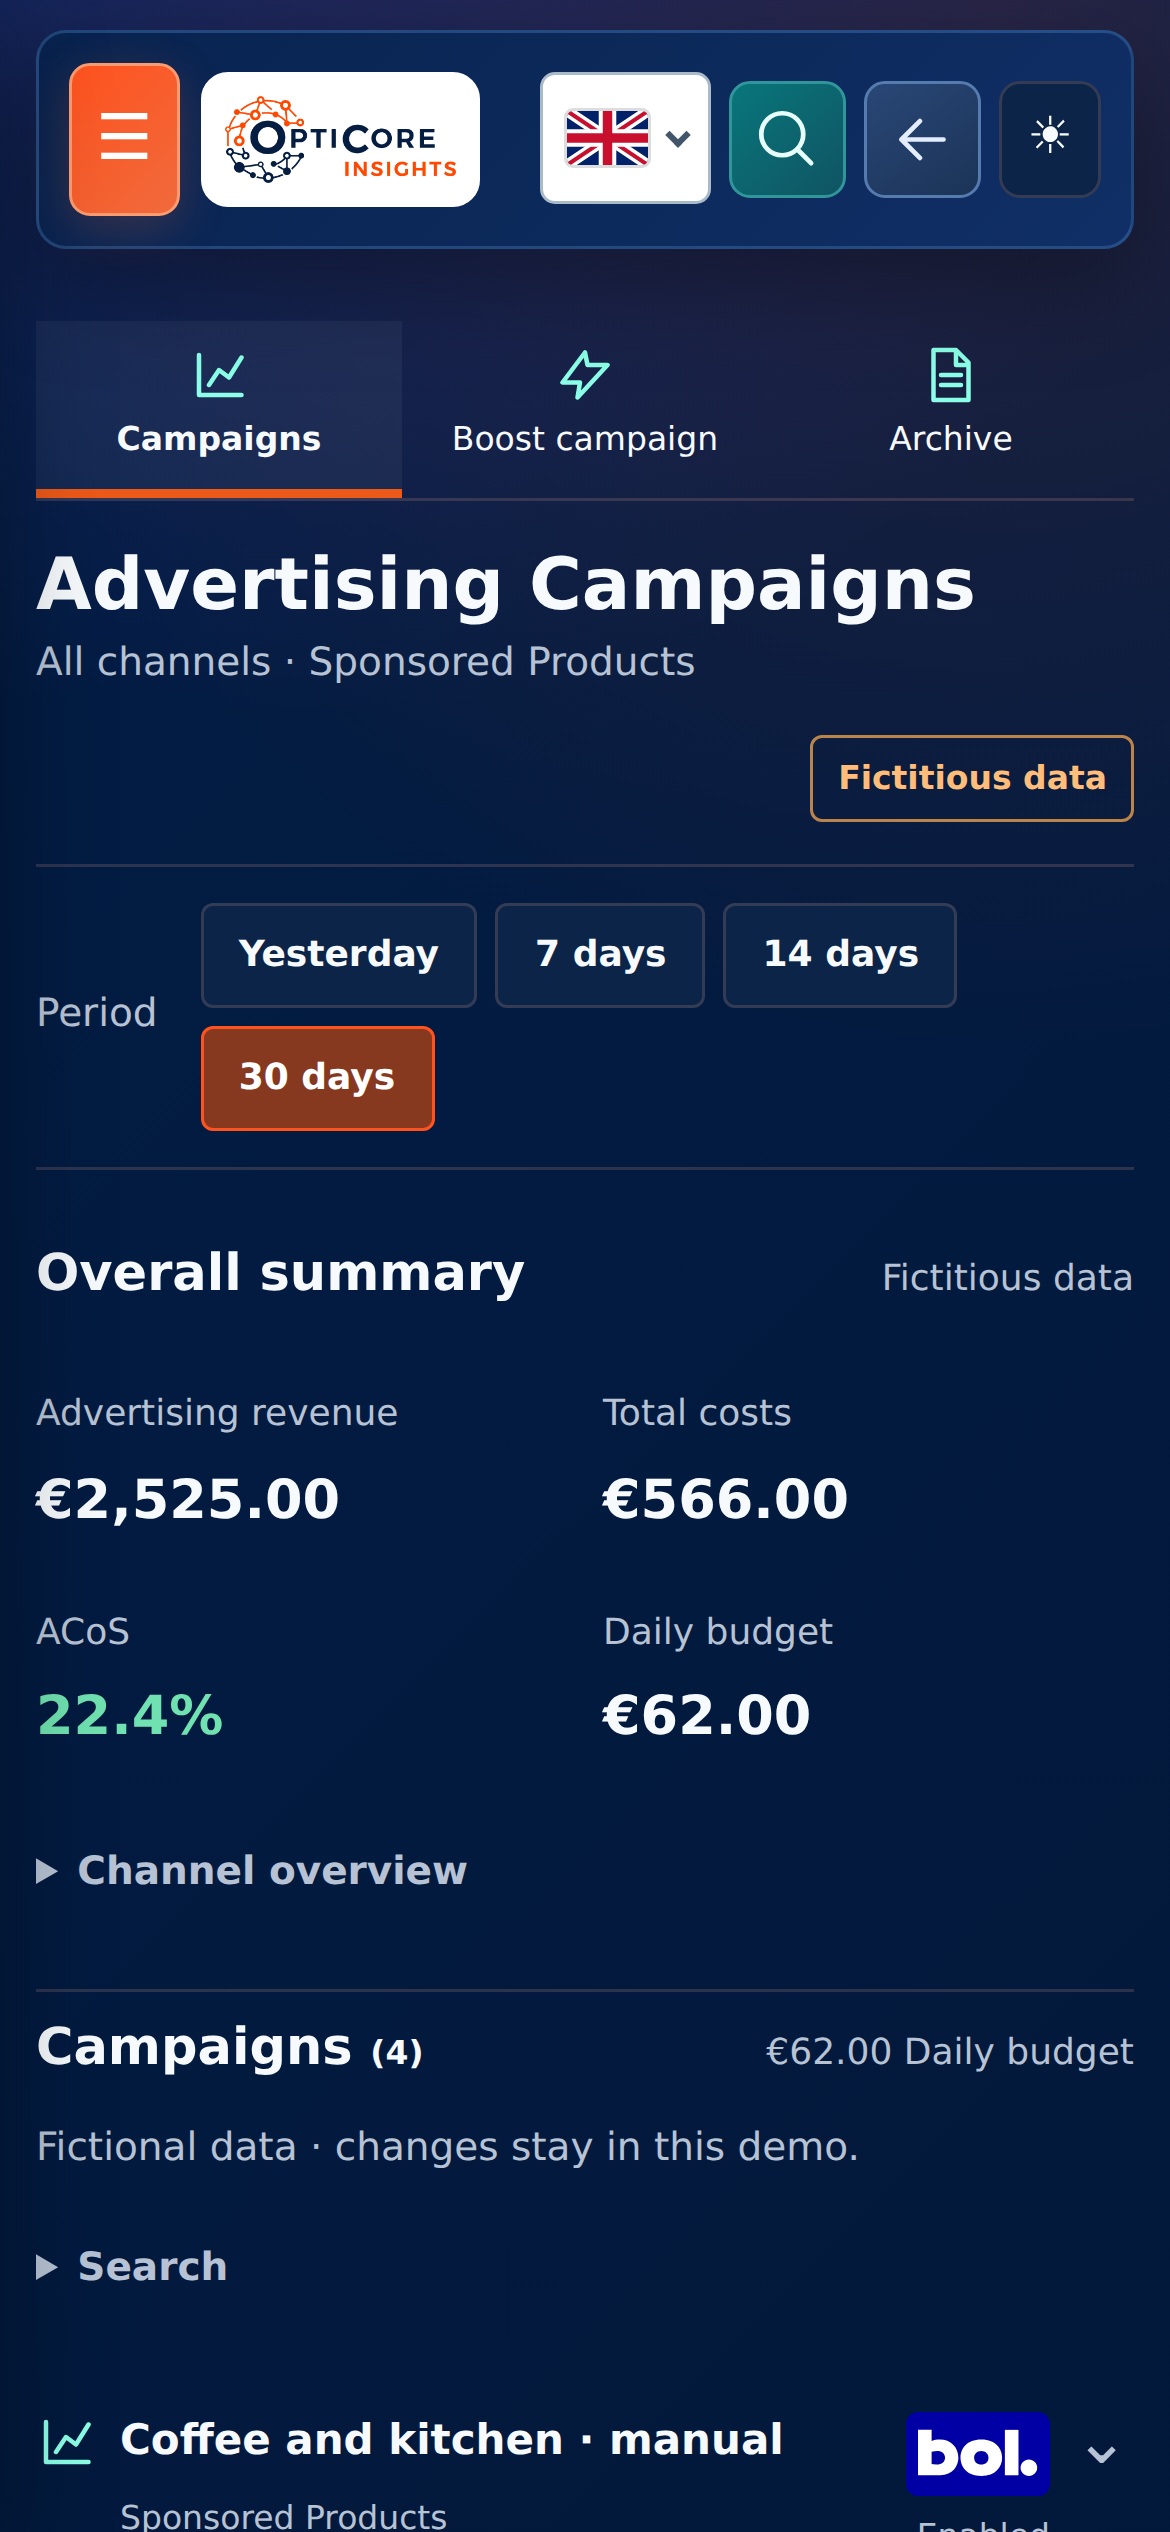
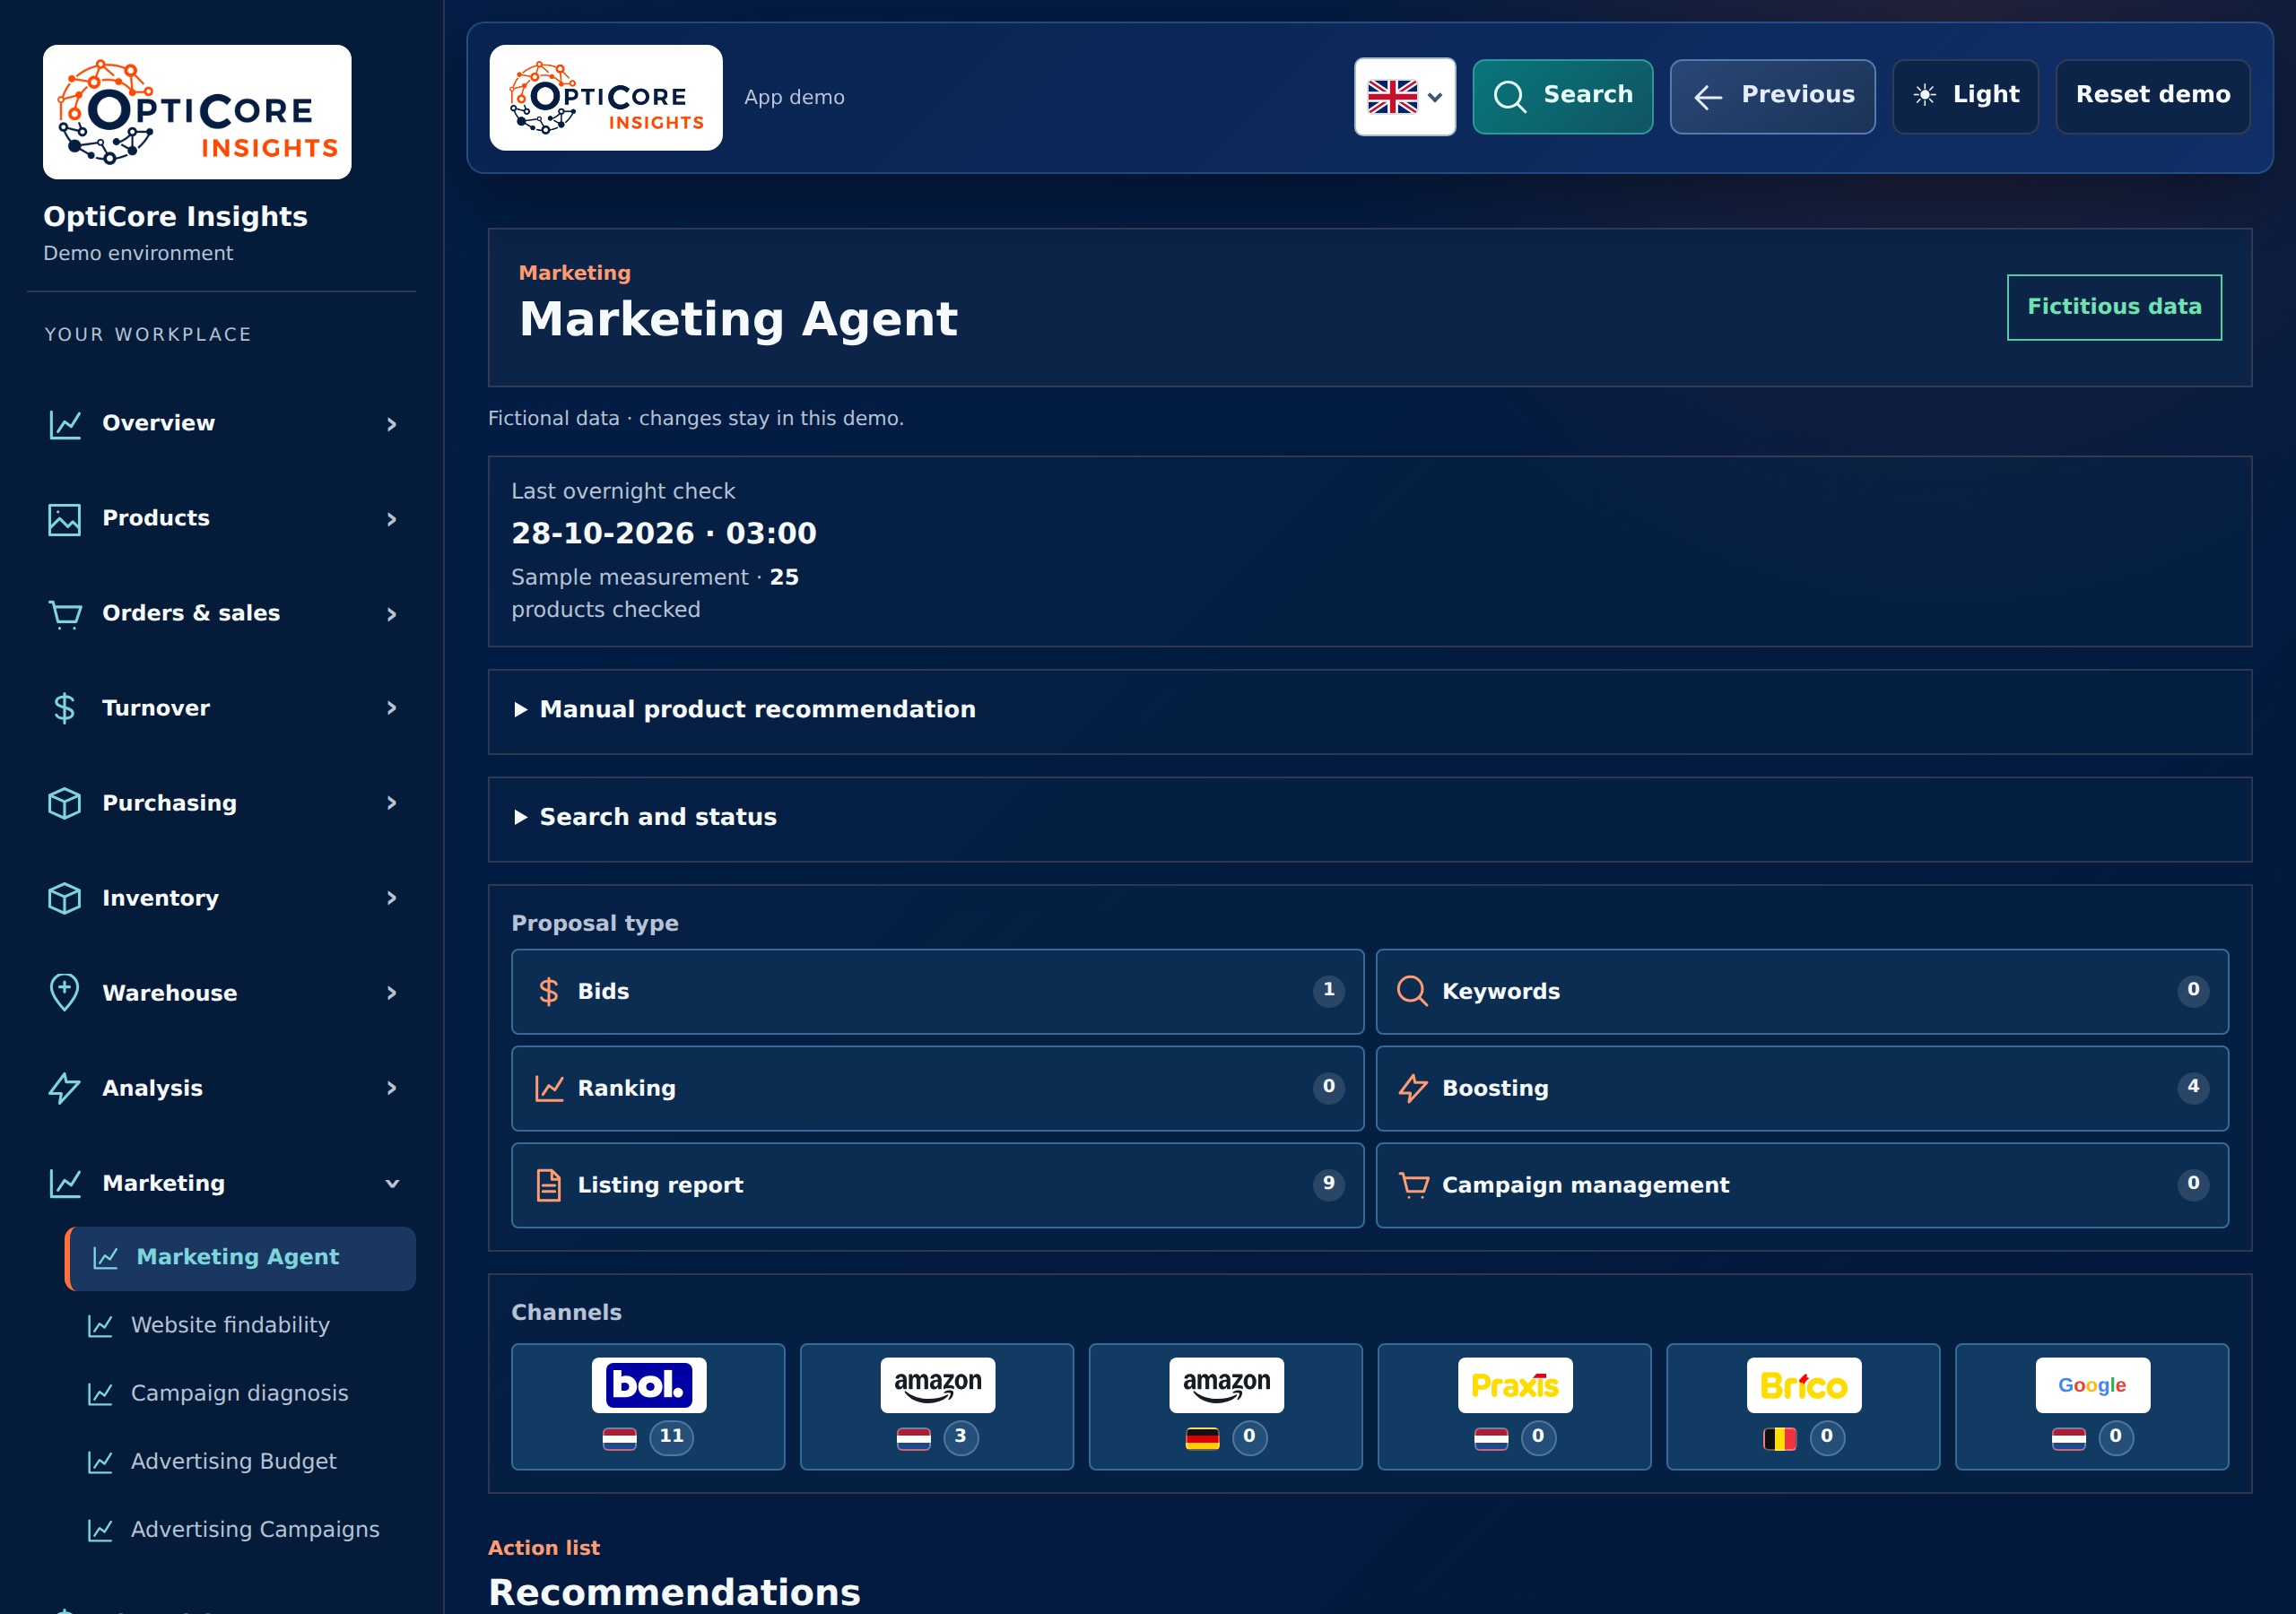
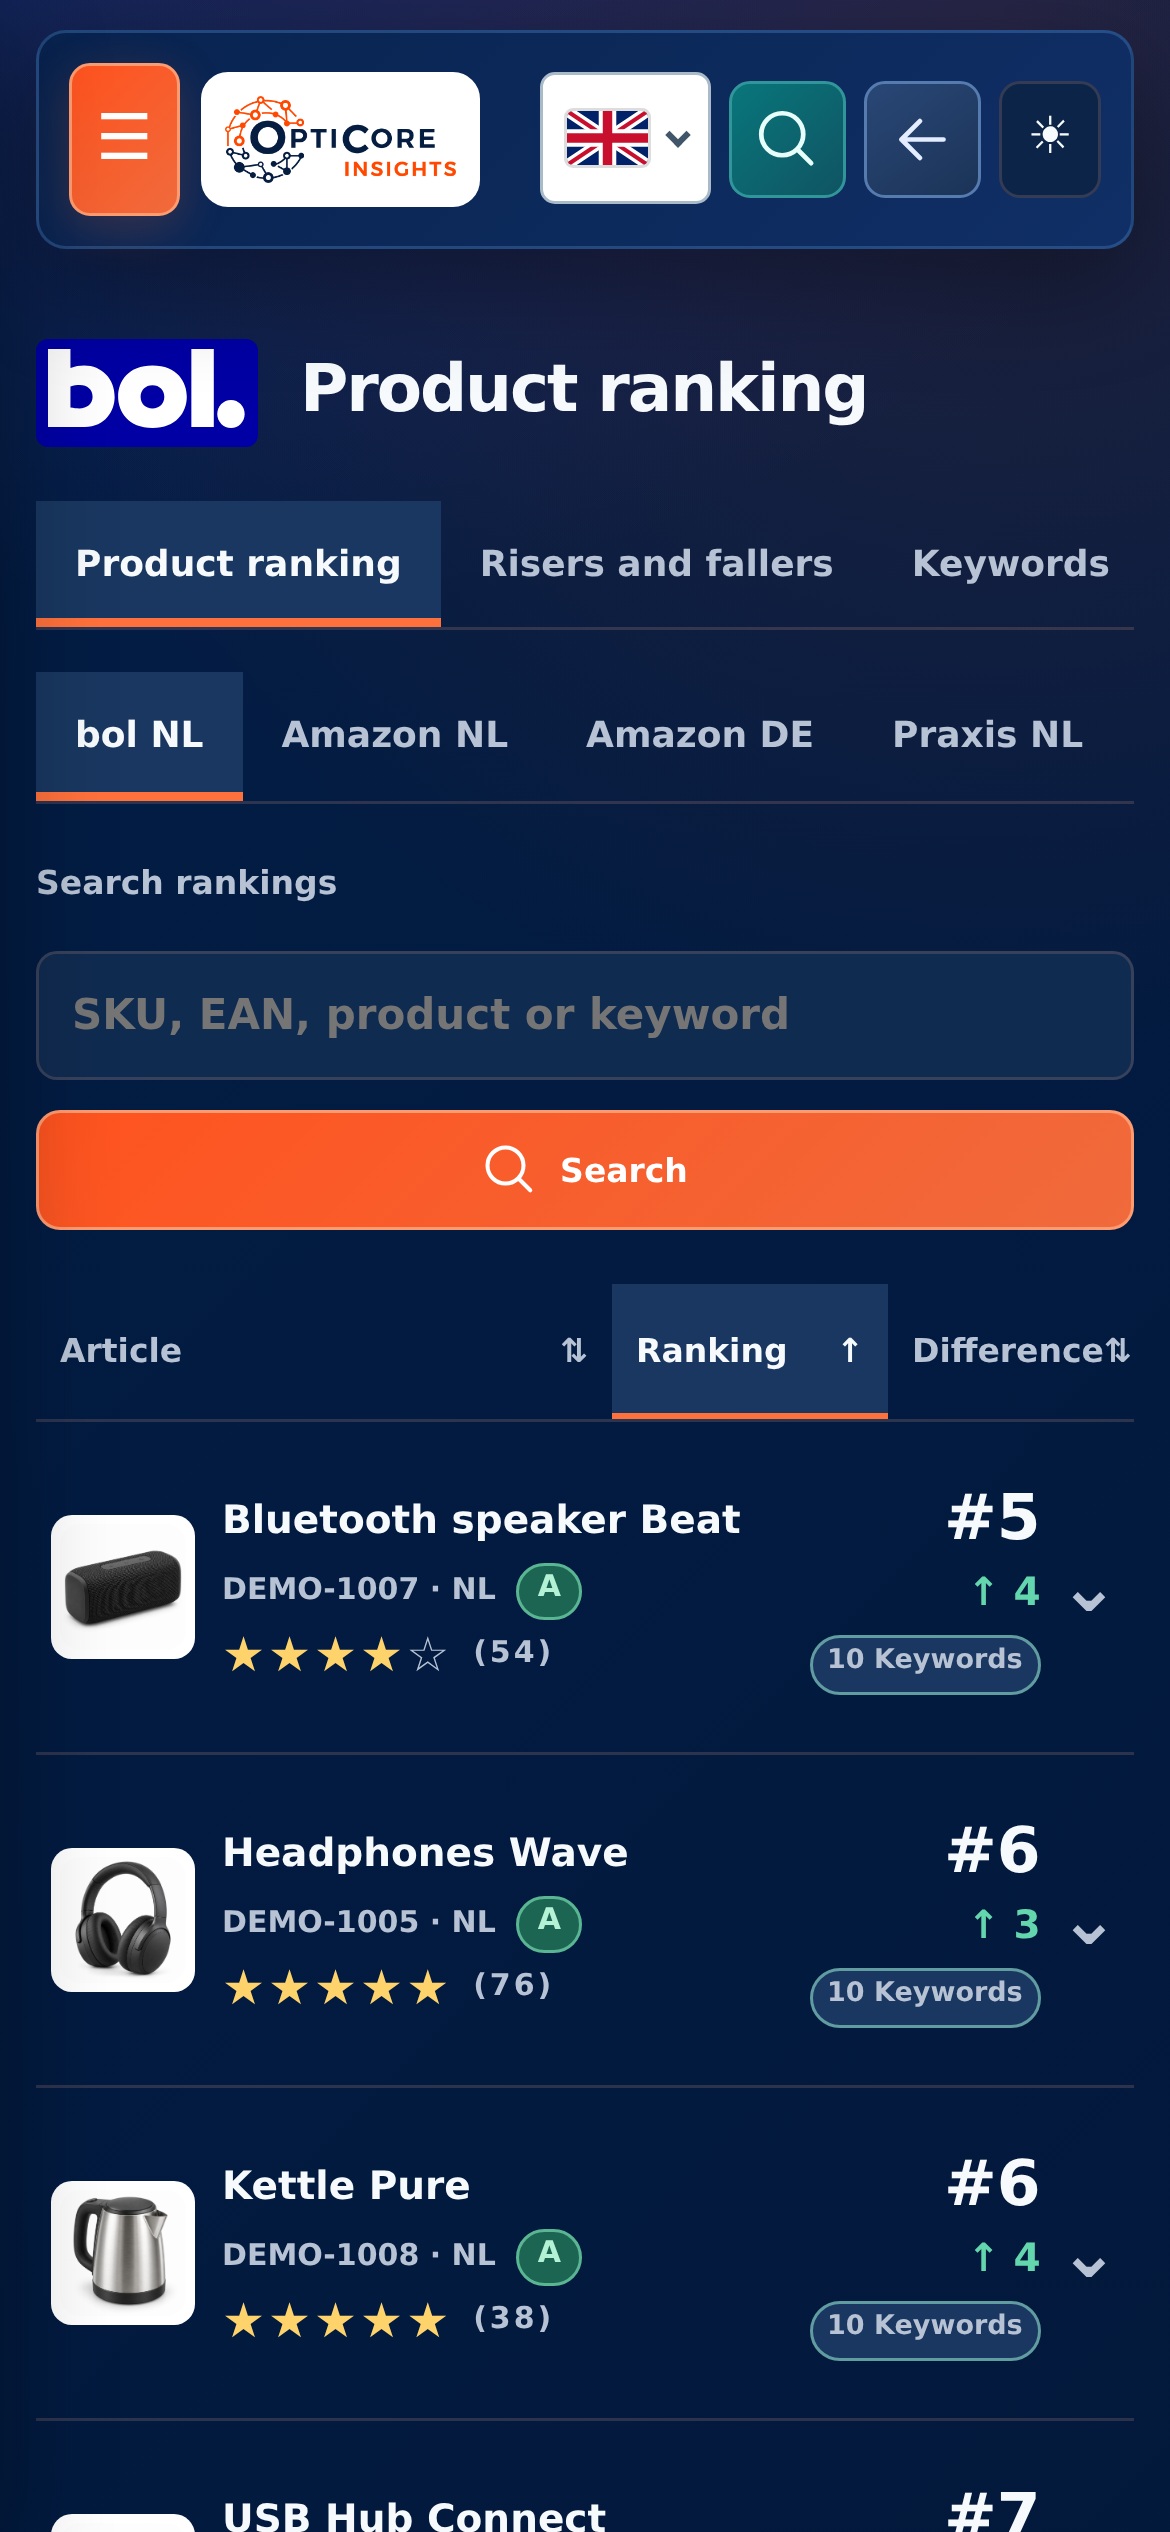
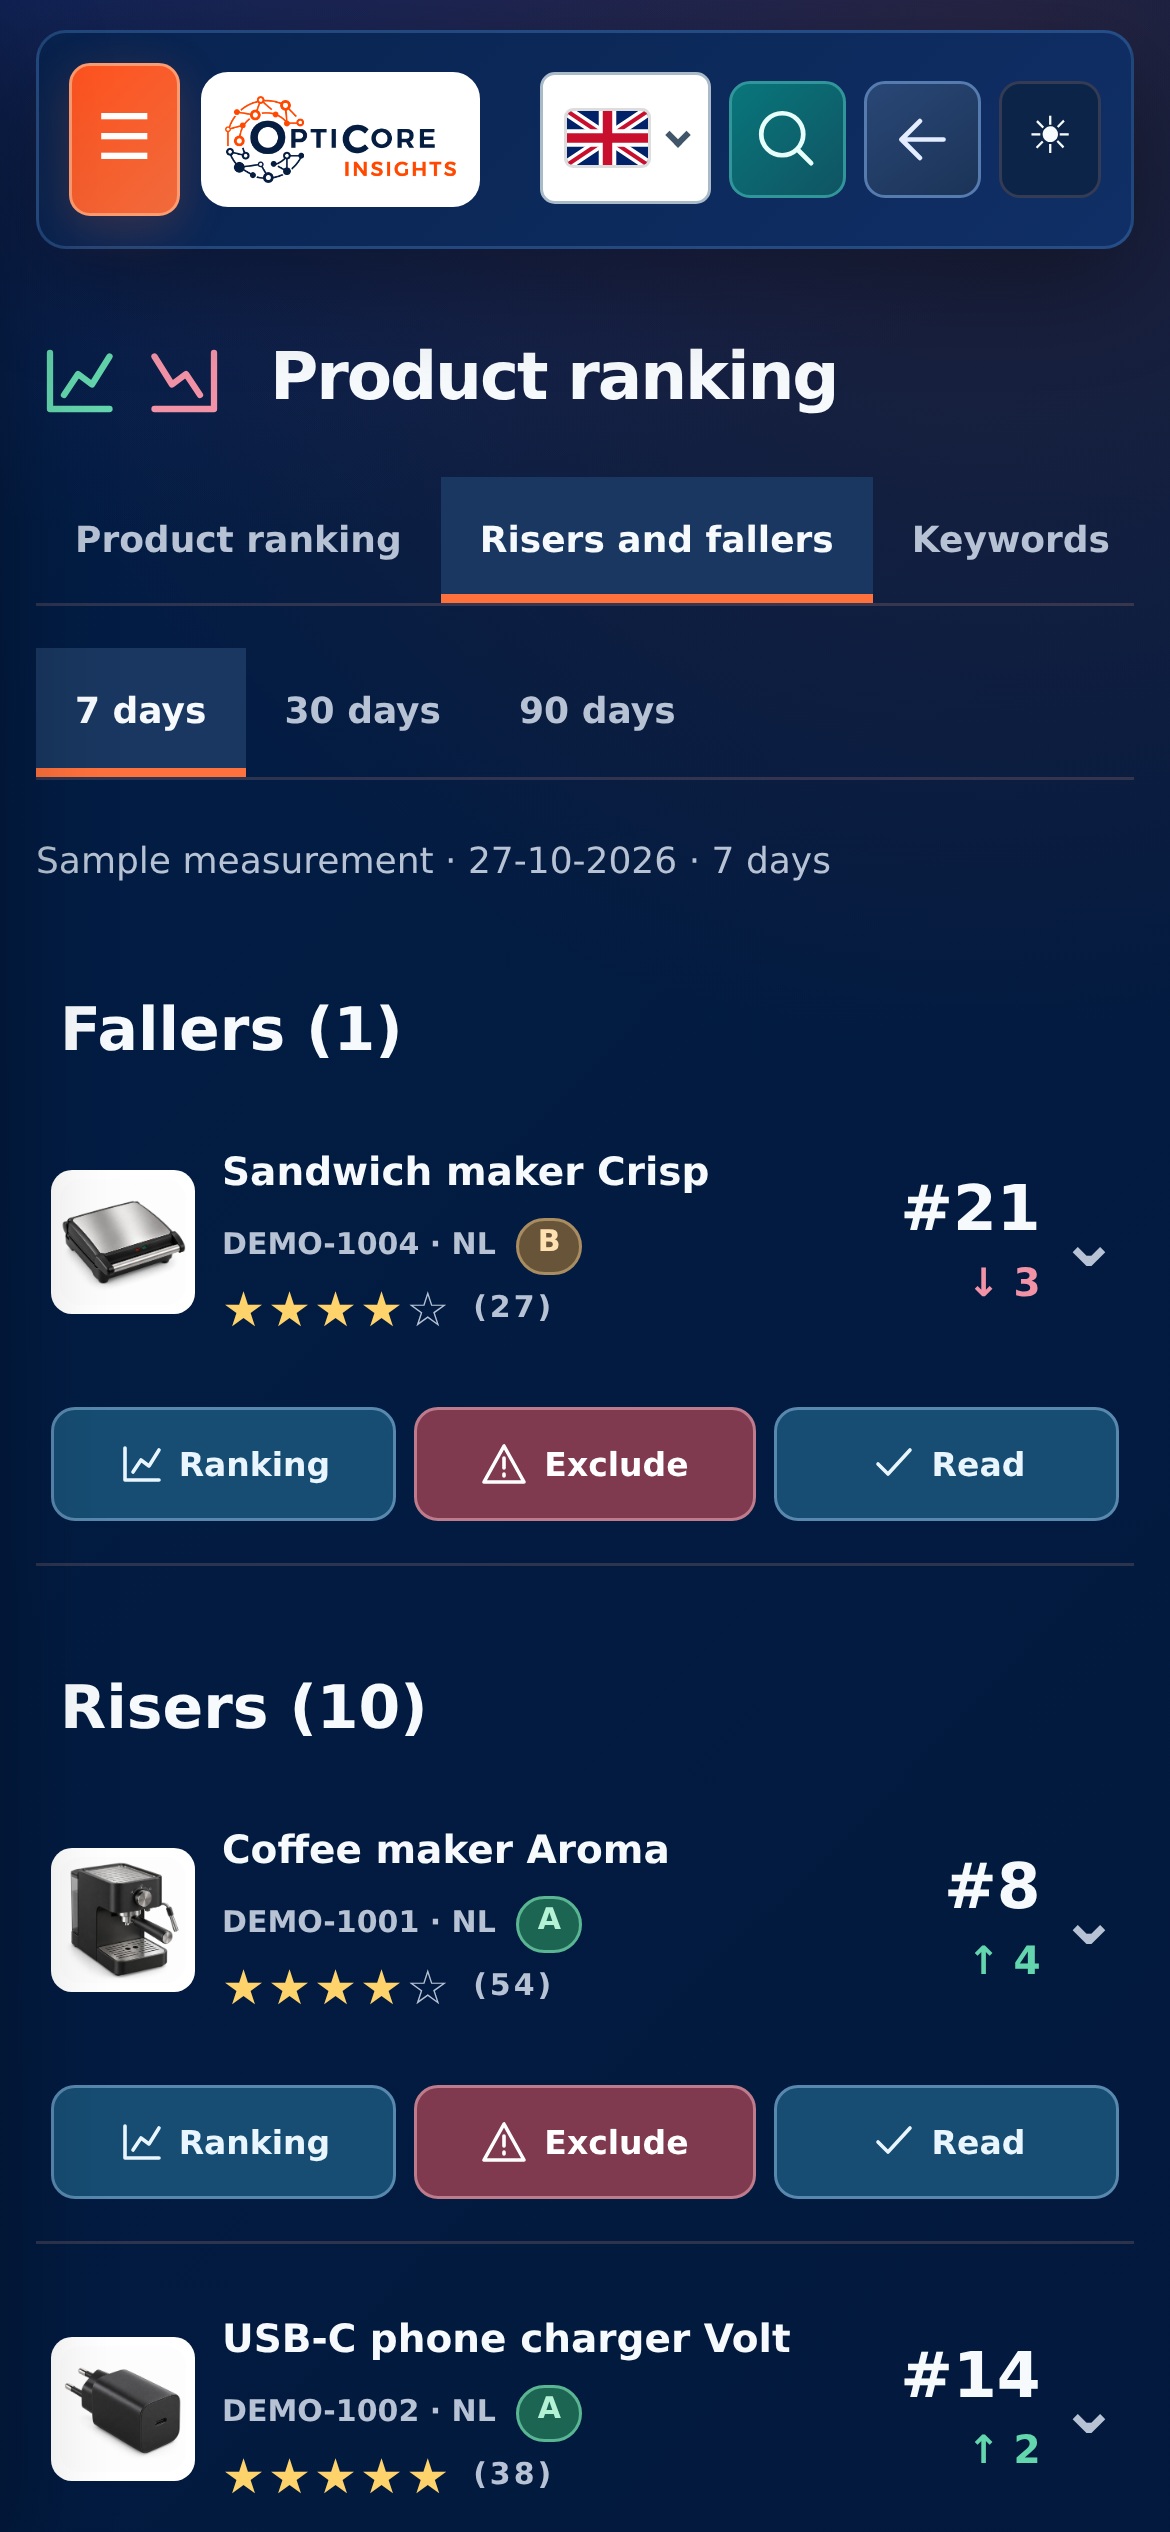
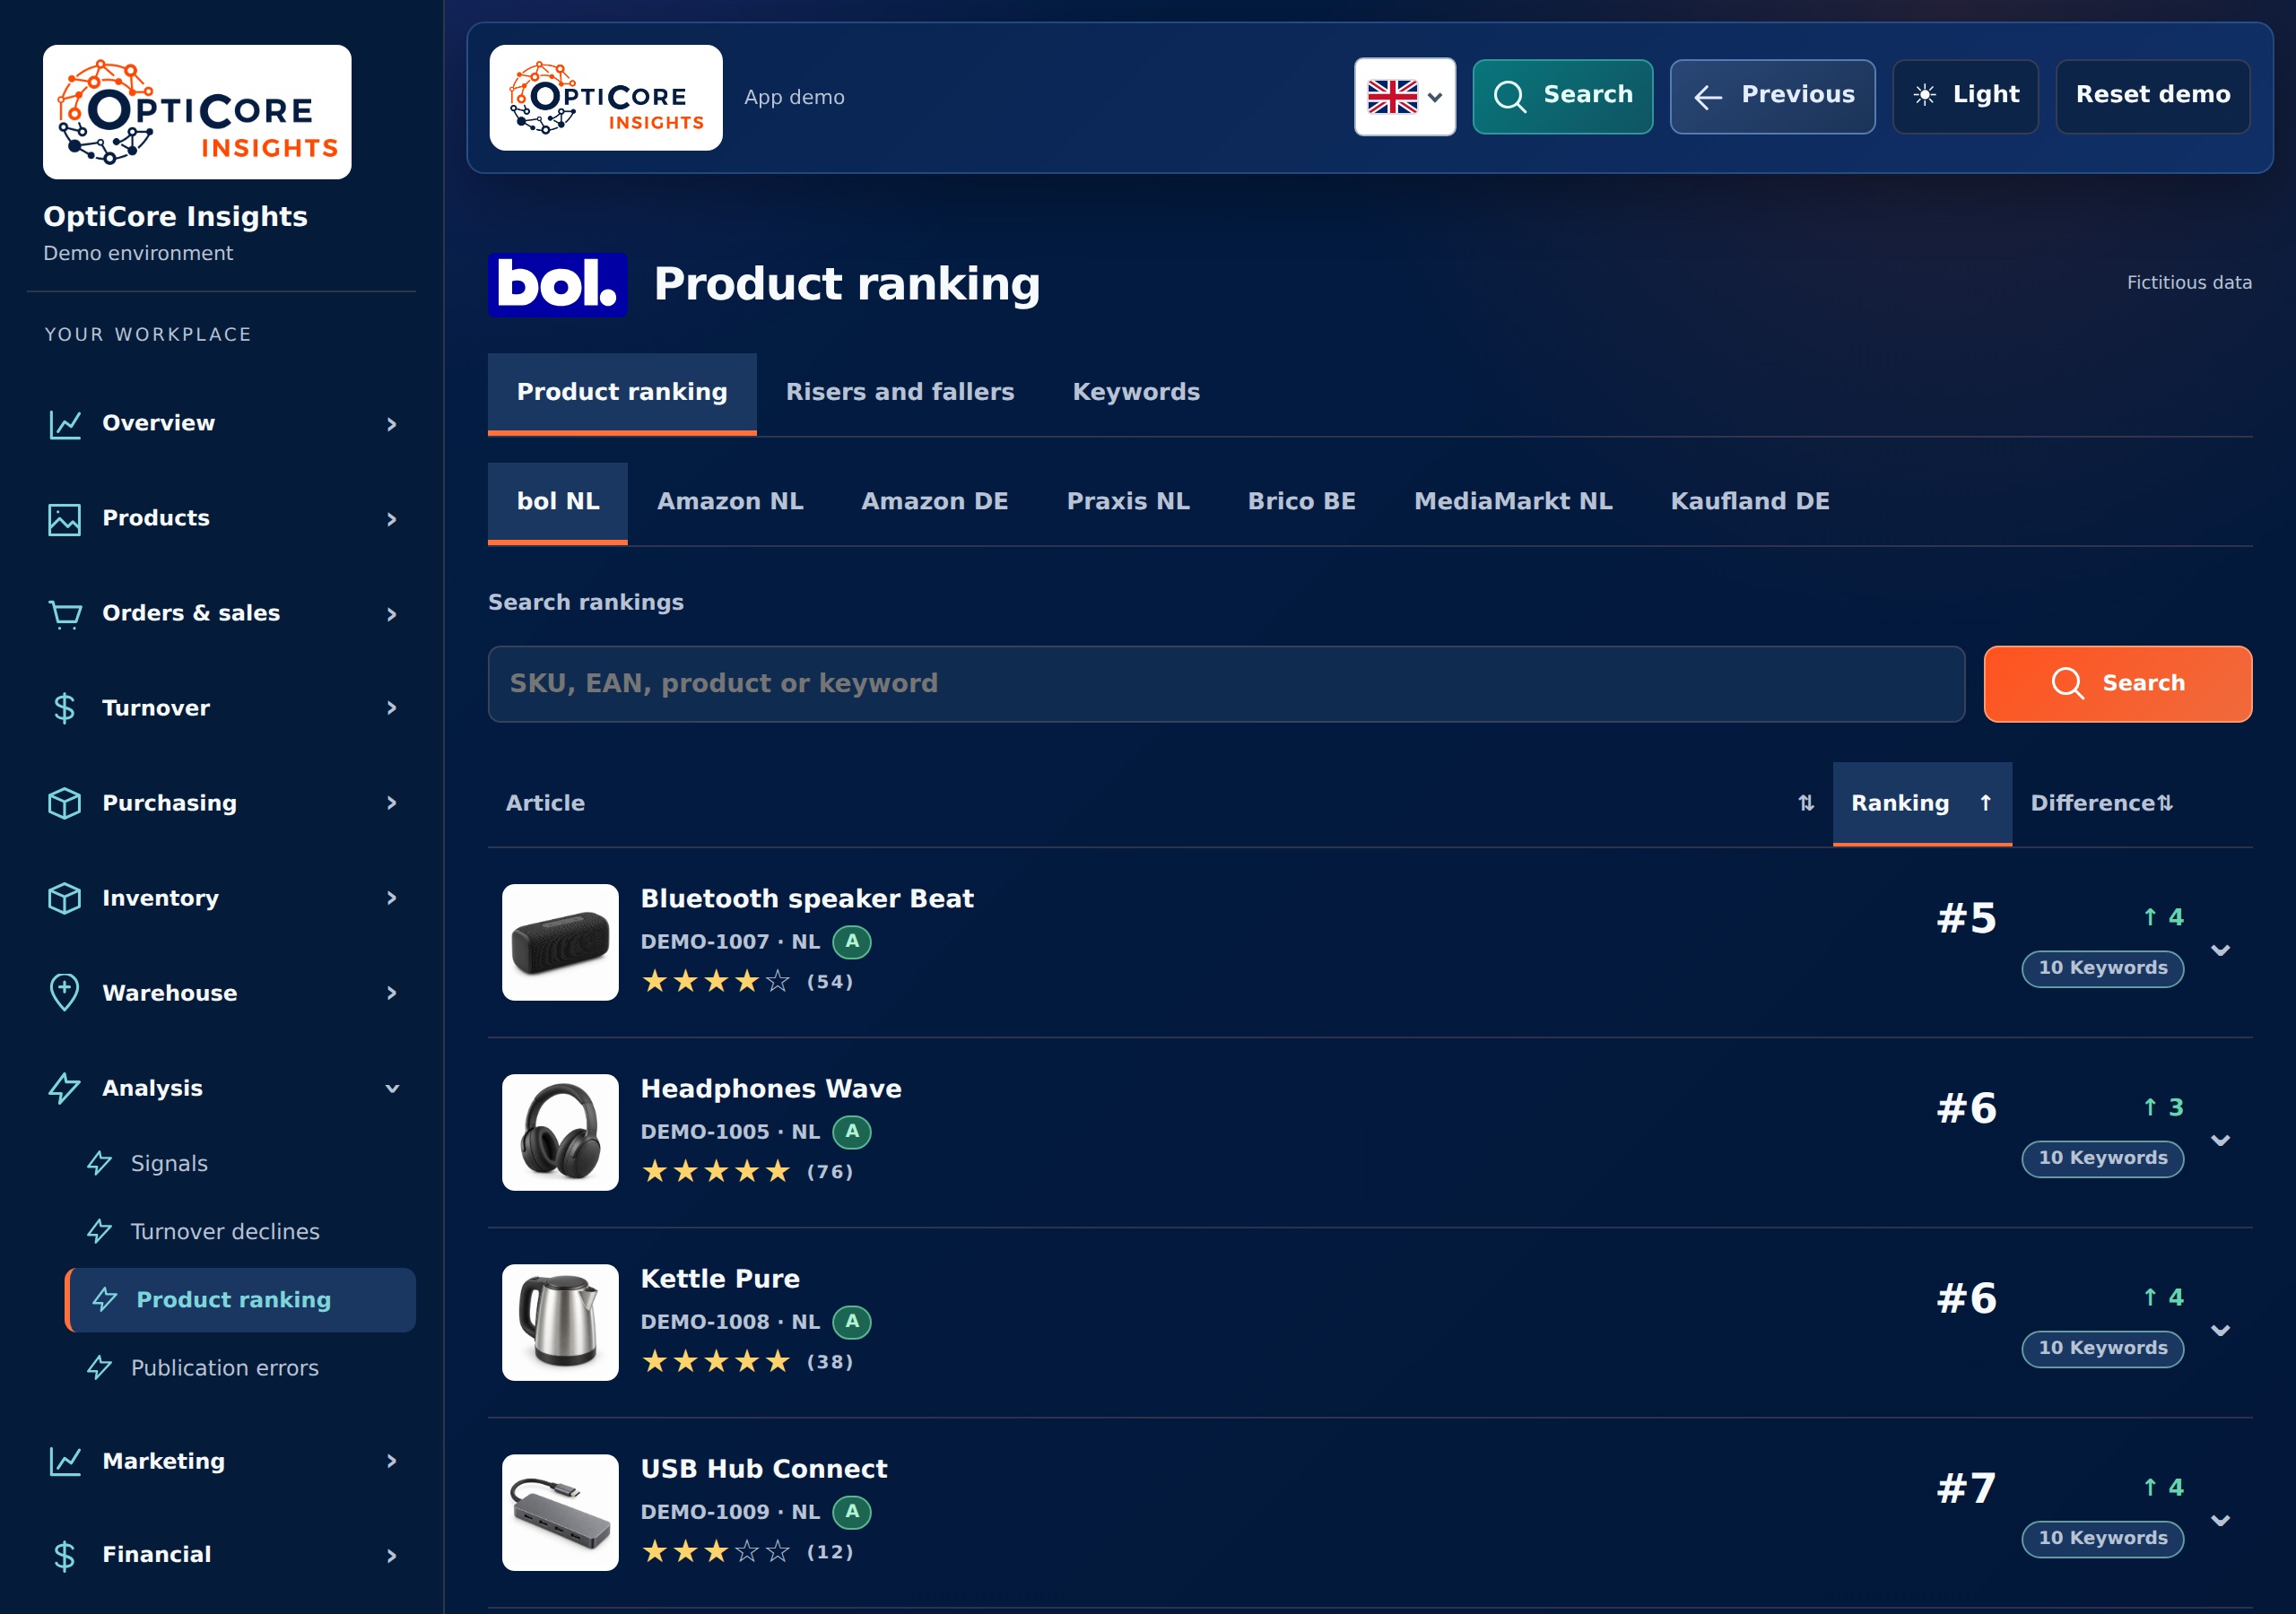
Dashboard and e-commerce
Management dashboard with turnover, margin, inventory and marketing. With links to the sales channels.
View Smartlife DomoticaHours and administration

Relationships, weekly statements and payroll control together, with approval steps and invoice preparation.
View Top Groep NederlandWe look at your question, the users and the available material. We then agree on what the first version will contain.
You see the structure and a working version. Together we check whether the content and functions match practice.
We review the most important actions, process the feedback and agree on publication and follow-up.
Your dashboard can contain financial data, customer information, and actions. We include login, password storage, two-step verification and management in the agreements for your application.
 Power BI
Building reports around existing data sources.
Reporting and working in the same application.
Start with the questions you want to answer.
Compare numbers and investigate discrepancies.
Connect reports with inventory, ordering and logistics. Start with the modules you need now and expand in a targeted manner.
Tell us what you want to have made or what work currently takes a lot of time.
Discuss your questionPower BI and Excel icons from Microsoft · CC BY 4.0, unchanged. Python and PostgreSQL: official product logos, unchanged.
Our approach

We make agreements easy to understand and keep you informed about progress, decisions and next steps.

We bring relevant figures together and explain what they mean, helping you decide where action is needed.

We look at which recurring steps could work smarter, with attention to checks, exceptions and the people using them.

We start with a clearly defined step. Then we expand with purpose, based on what your business and workflow need.