

01 · The problem
A turnover figure does not yet tell you what to do.
An online store with multiple sales channels provides a lot of data. Orders are in the sales channel, product data in product management and advertising costs in yet another environment. To make a decision about results or stock, you must first bring that data together.
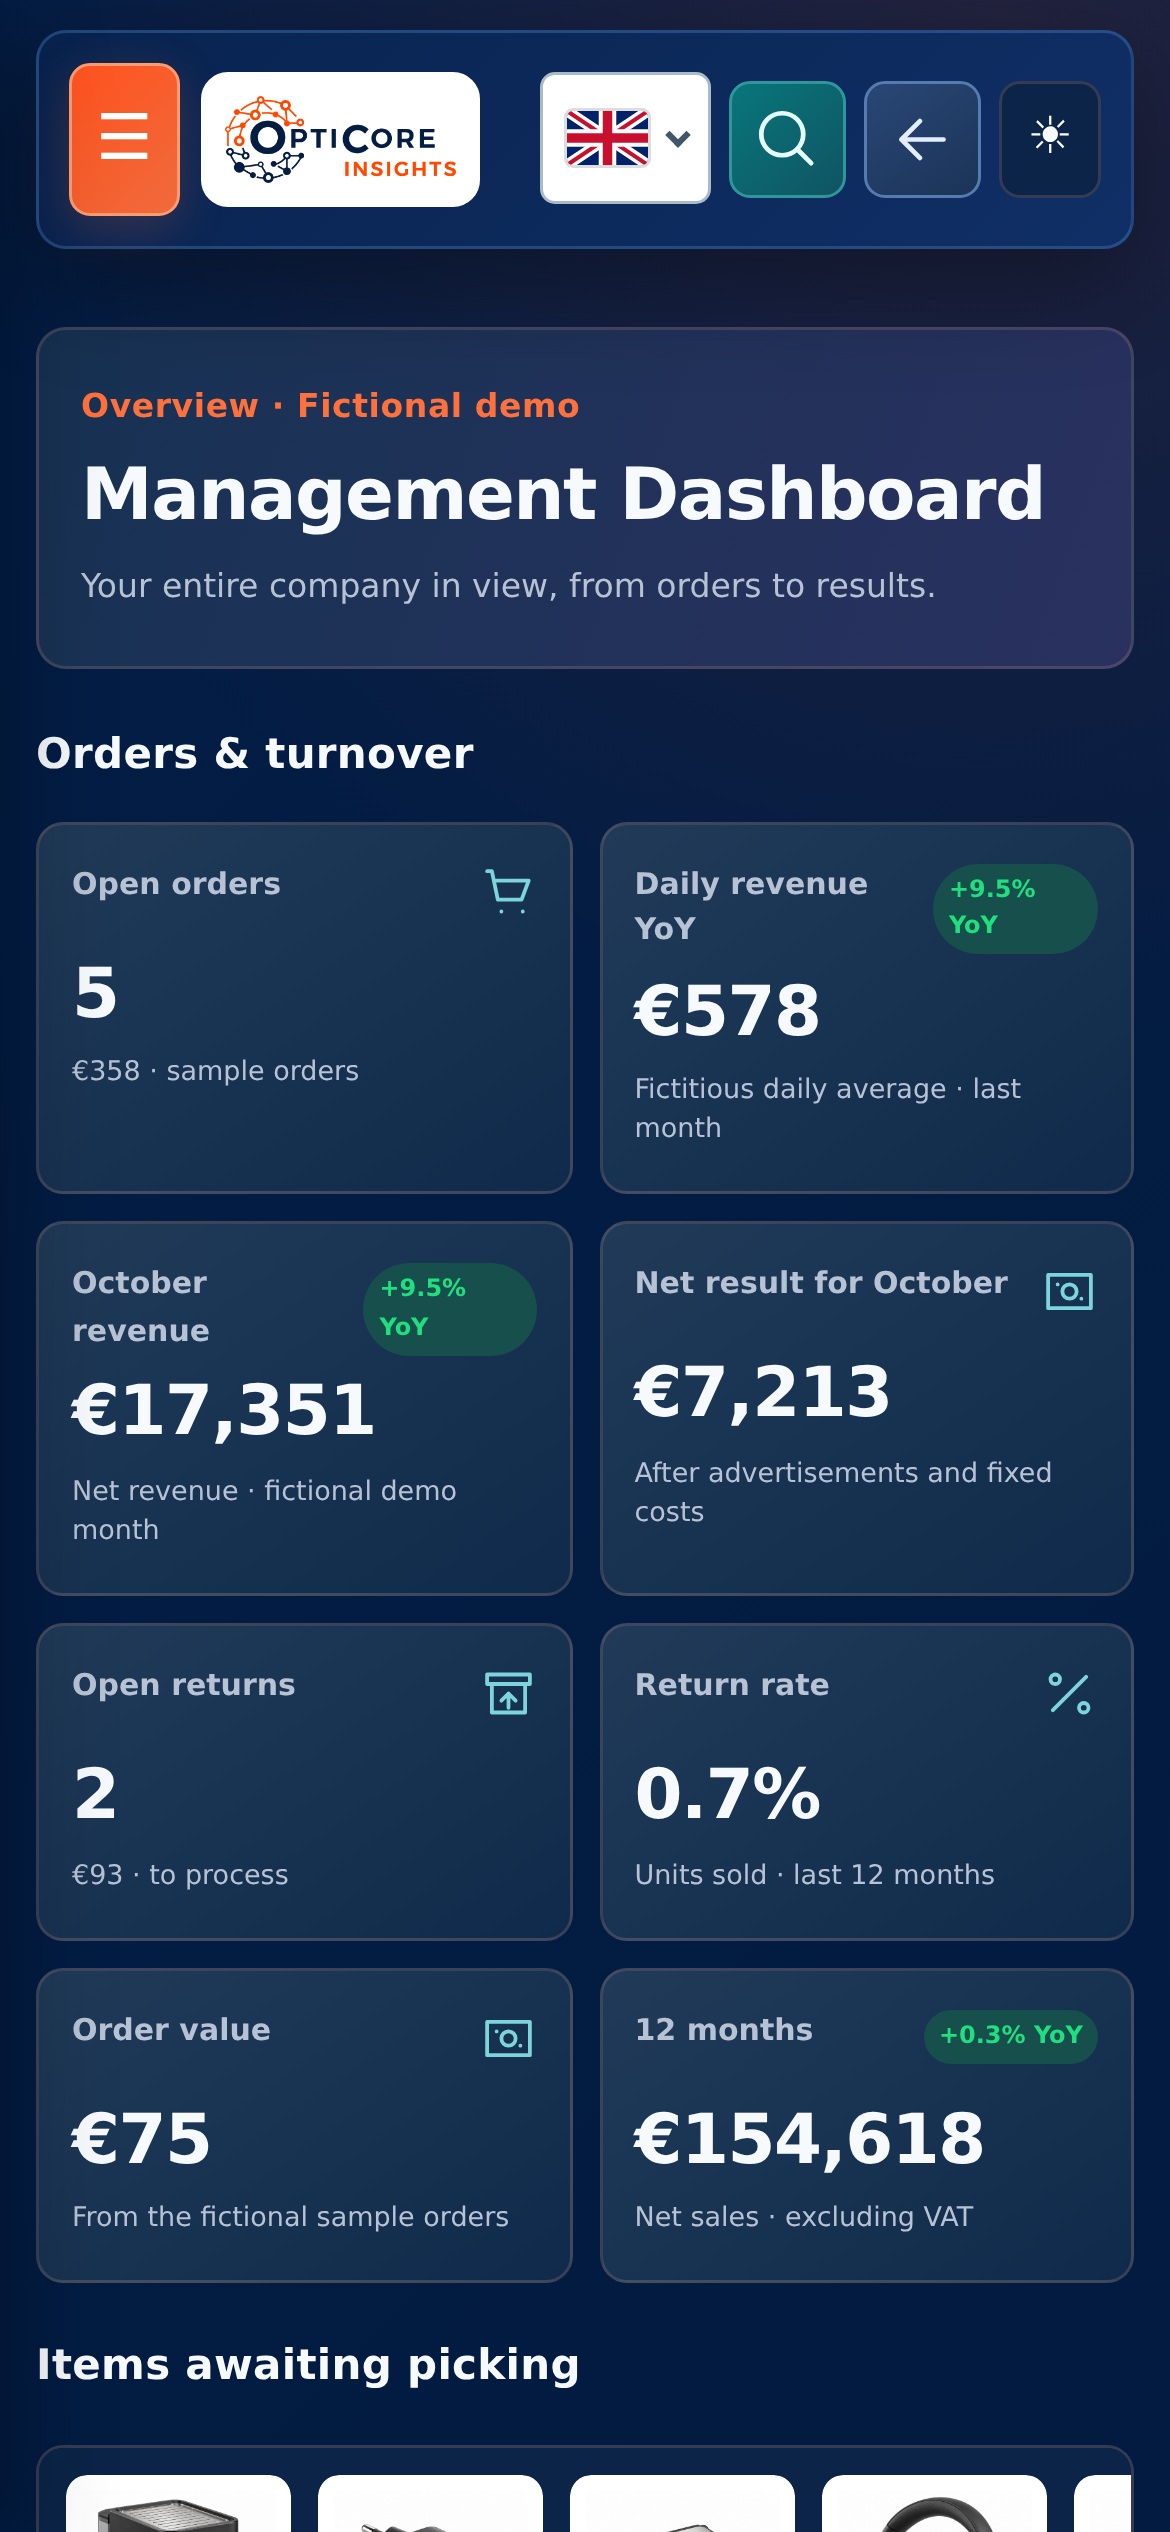
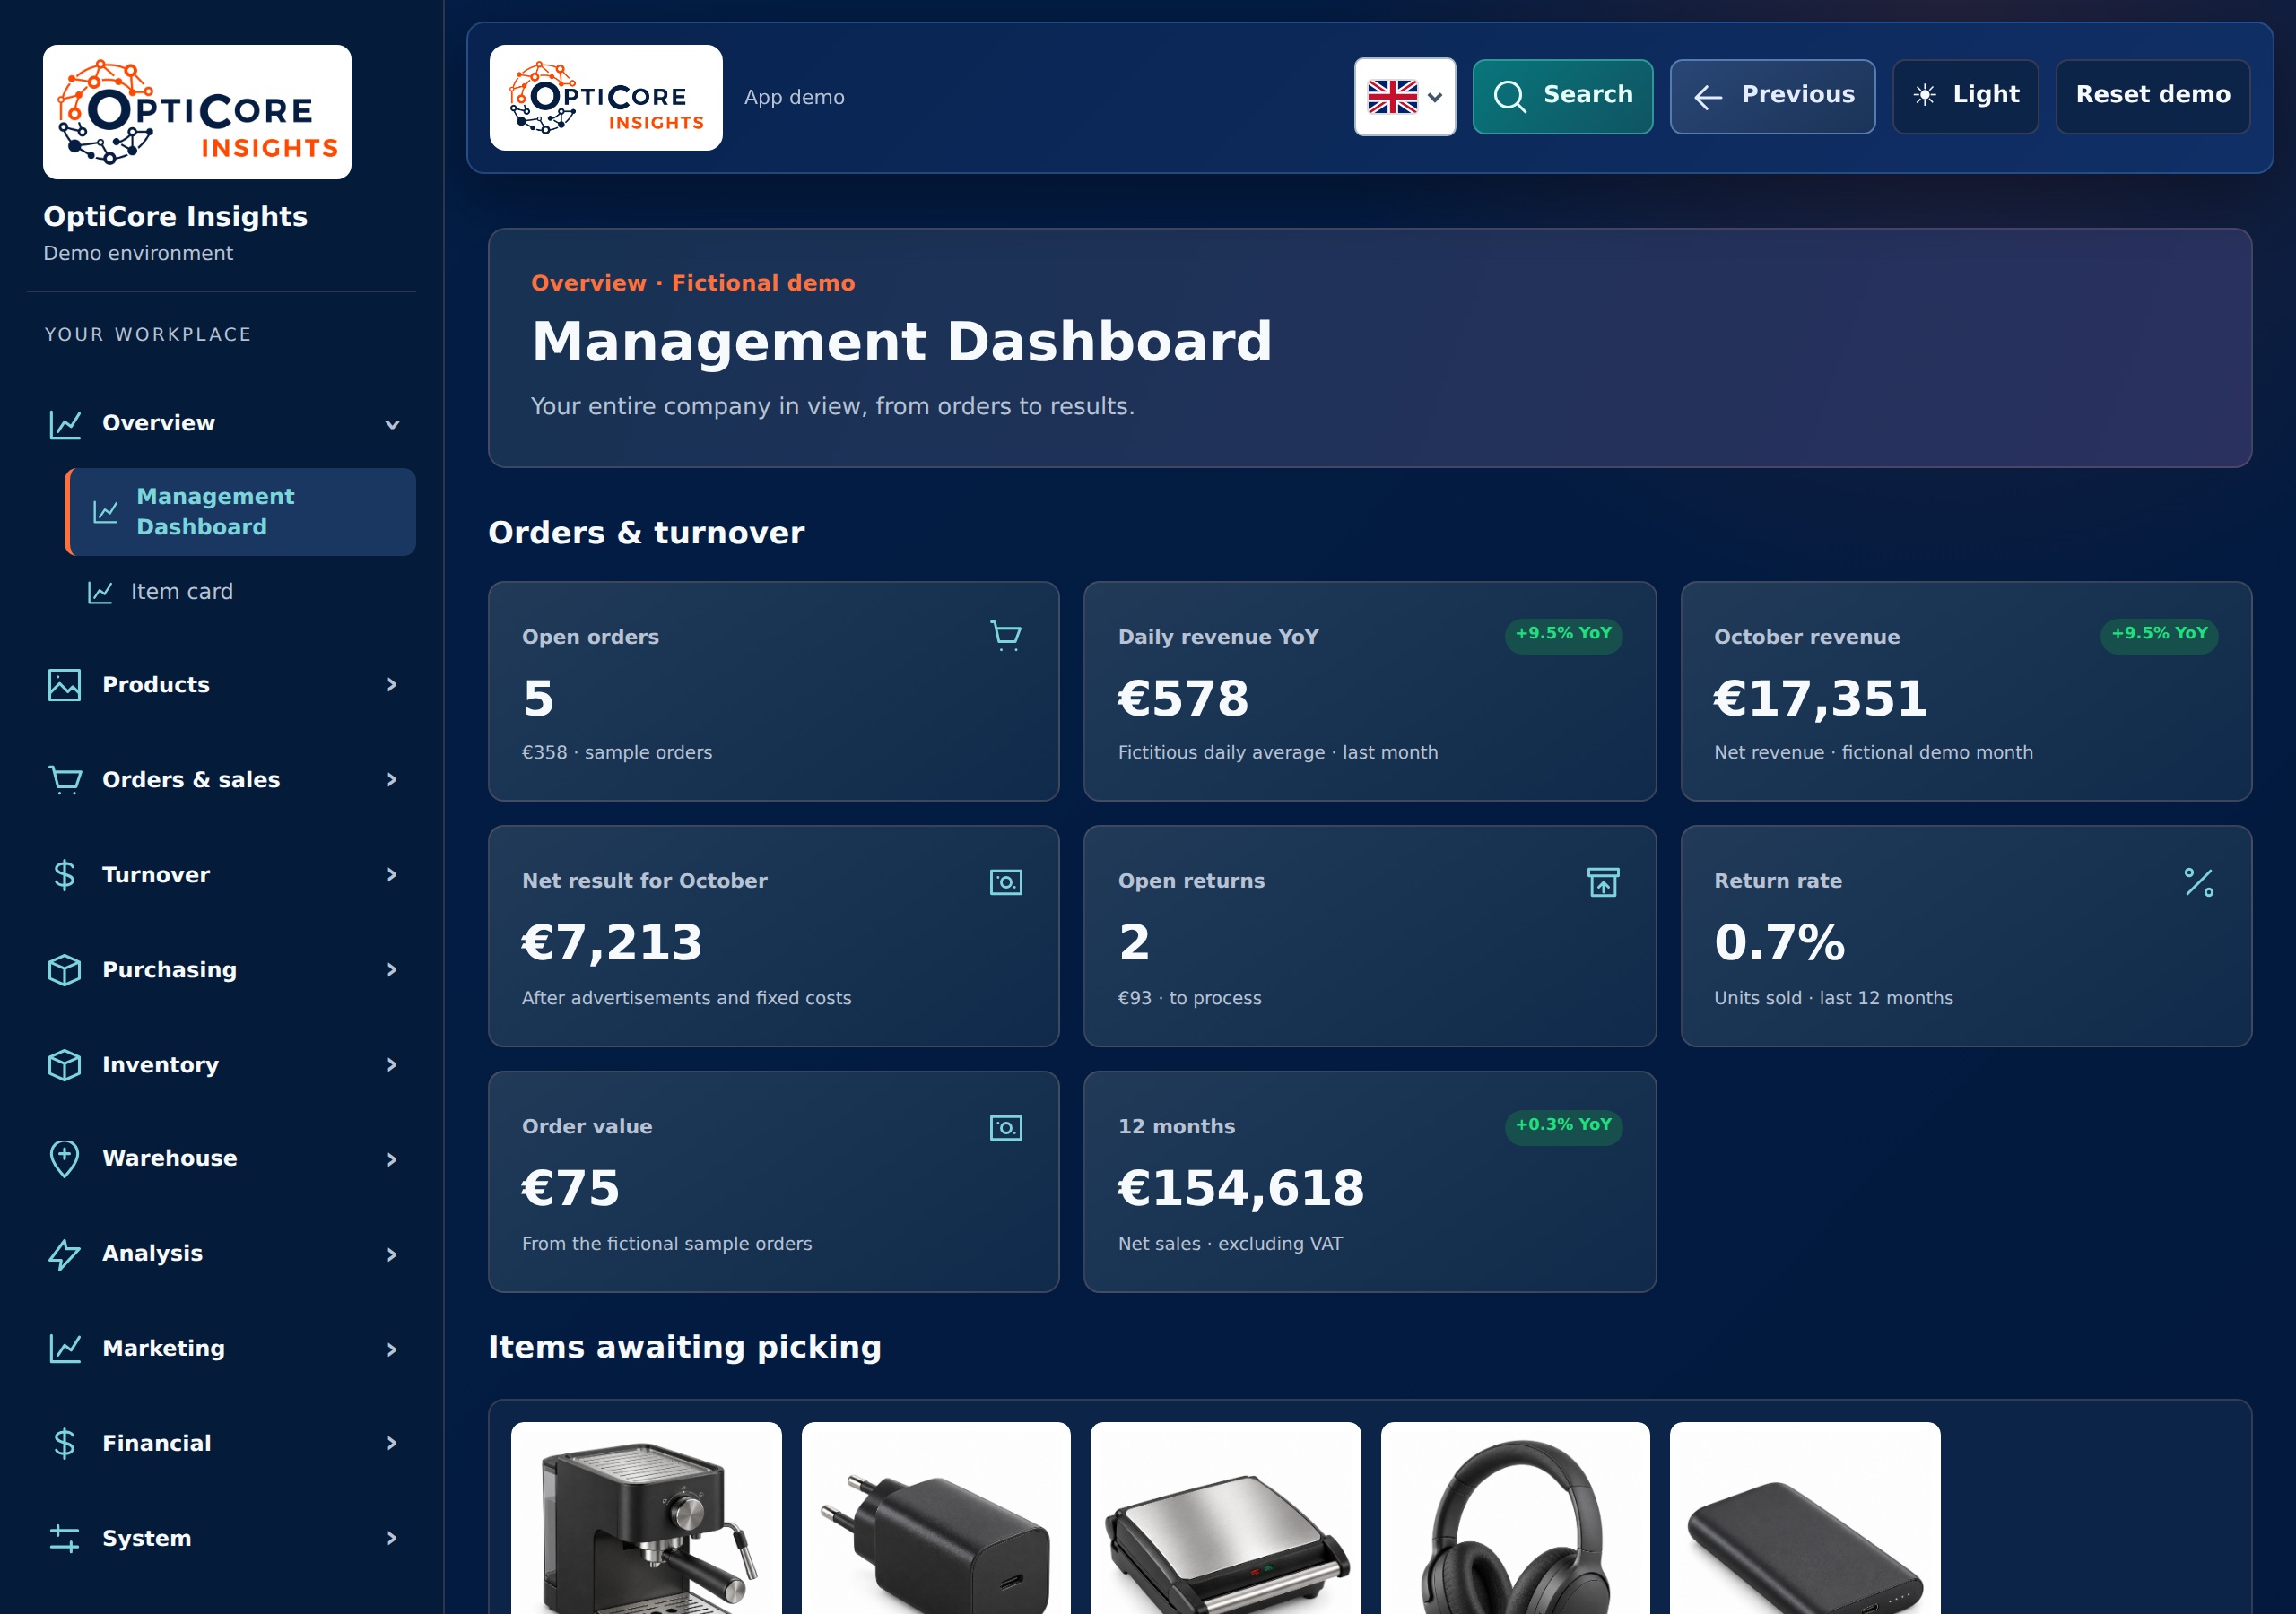
This is followed by a second question: where does a deviation come from? Increasing sales may be accompanied by a lower margin, more returns or additional advertising costs. The dashboard had to make this coherence visible and provide an entrance to the underlying work.
02 · Inventory
First determine the meaning of the numbers.
The technical inventory starts with the sources: ProductFlow, bol.com, the webshop and the additional data for costs and marketing. Period, item recognition and topicality are important for each component. A comparison only has meaning if you know what sales and costs are included.
Therefore, data freshness, job statuses and missing data are also part of the design. The user must be able to assess whether a striking figure is a business development or a reason to first check the processing.
03 · Plan of action
From management overview to the right work module.
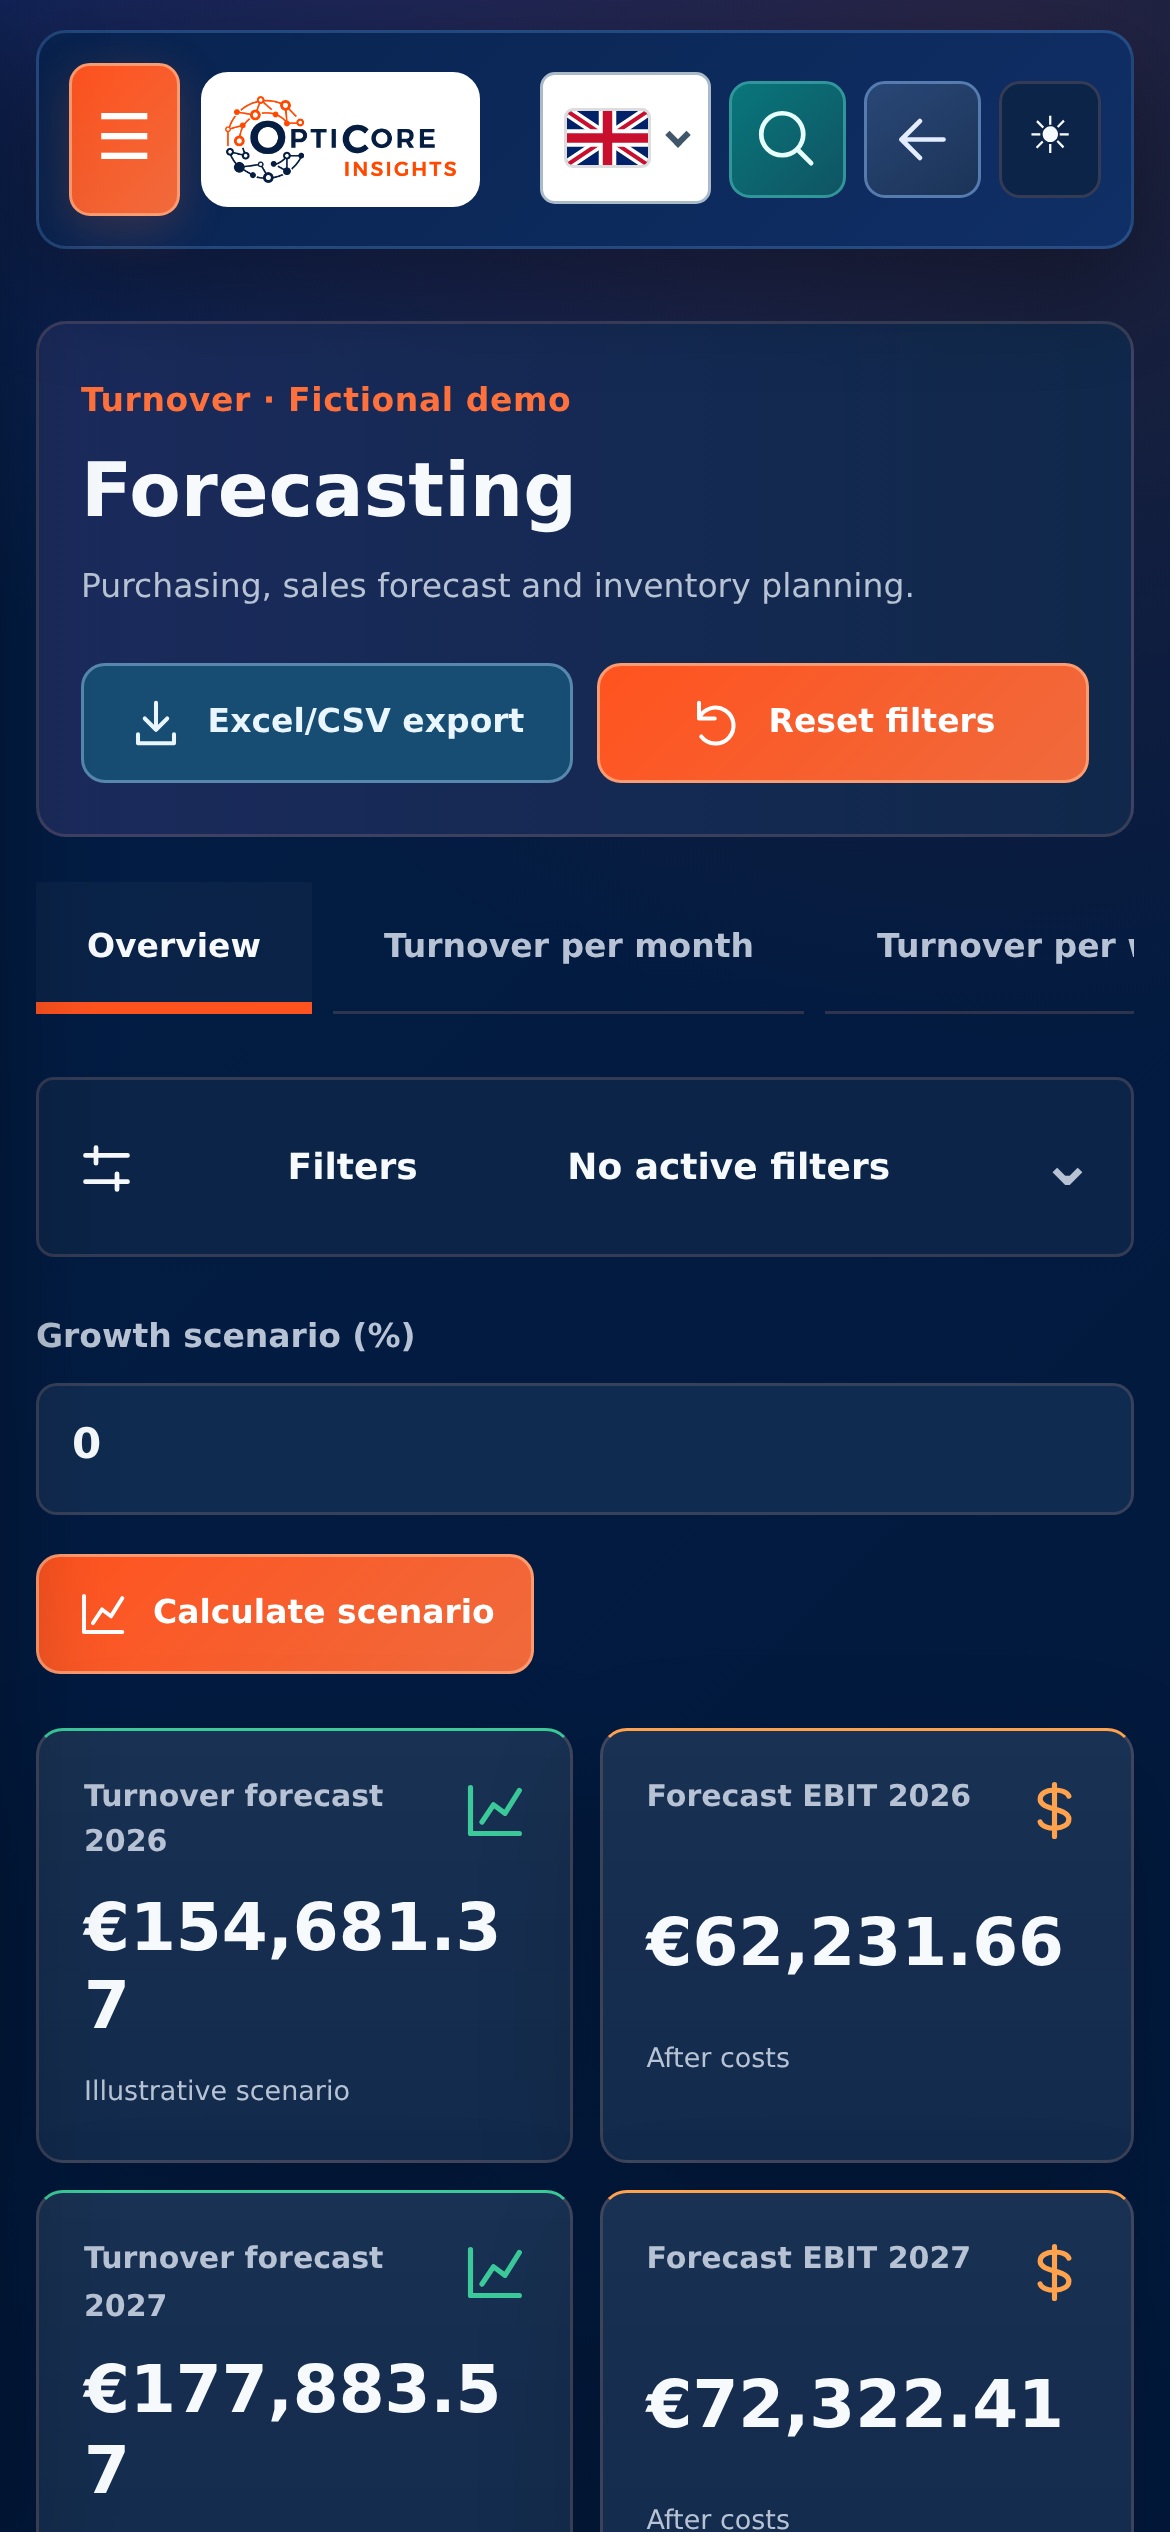
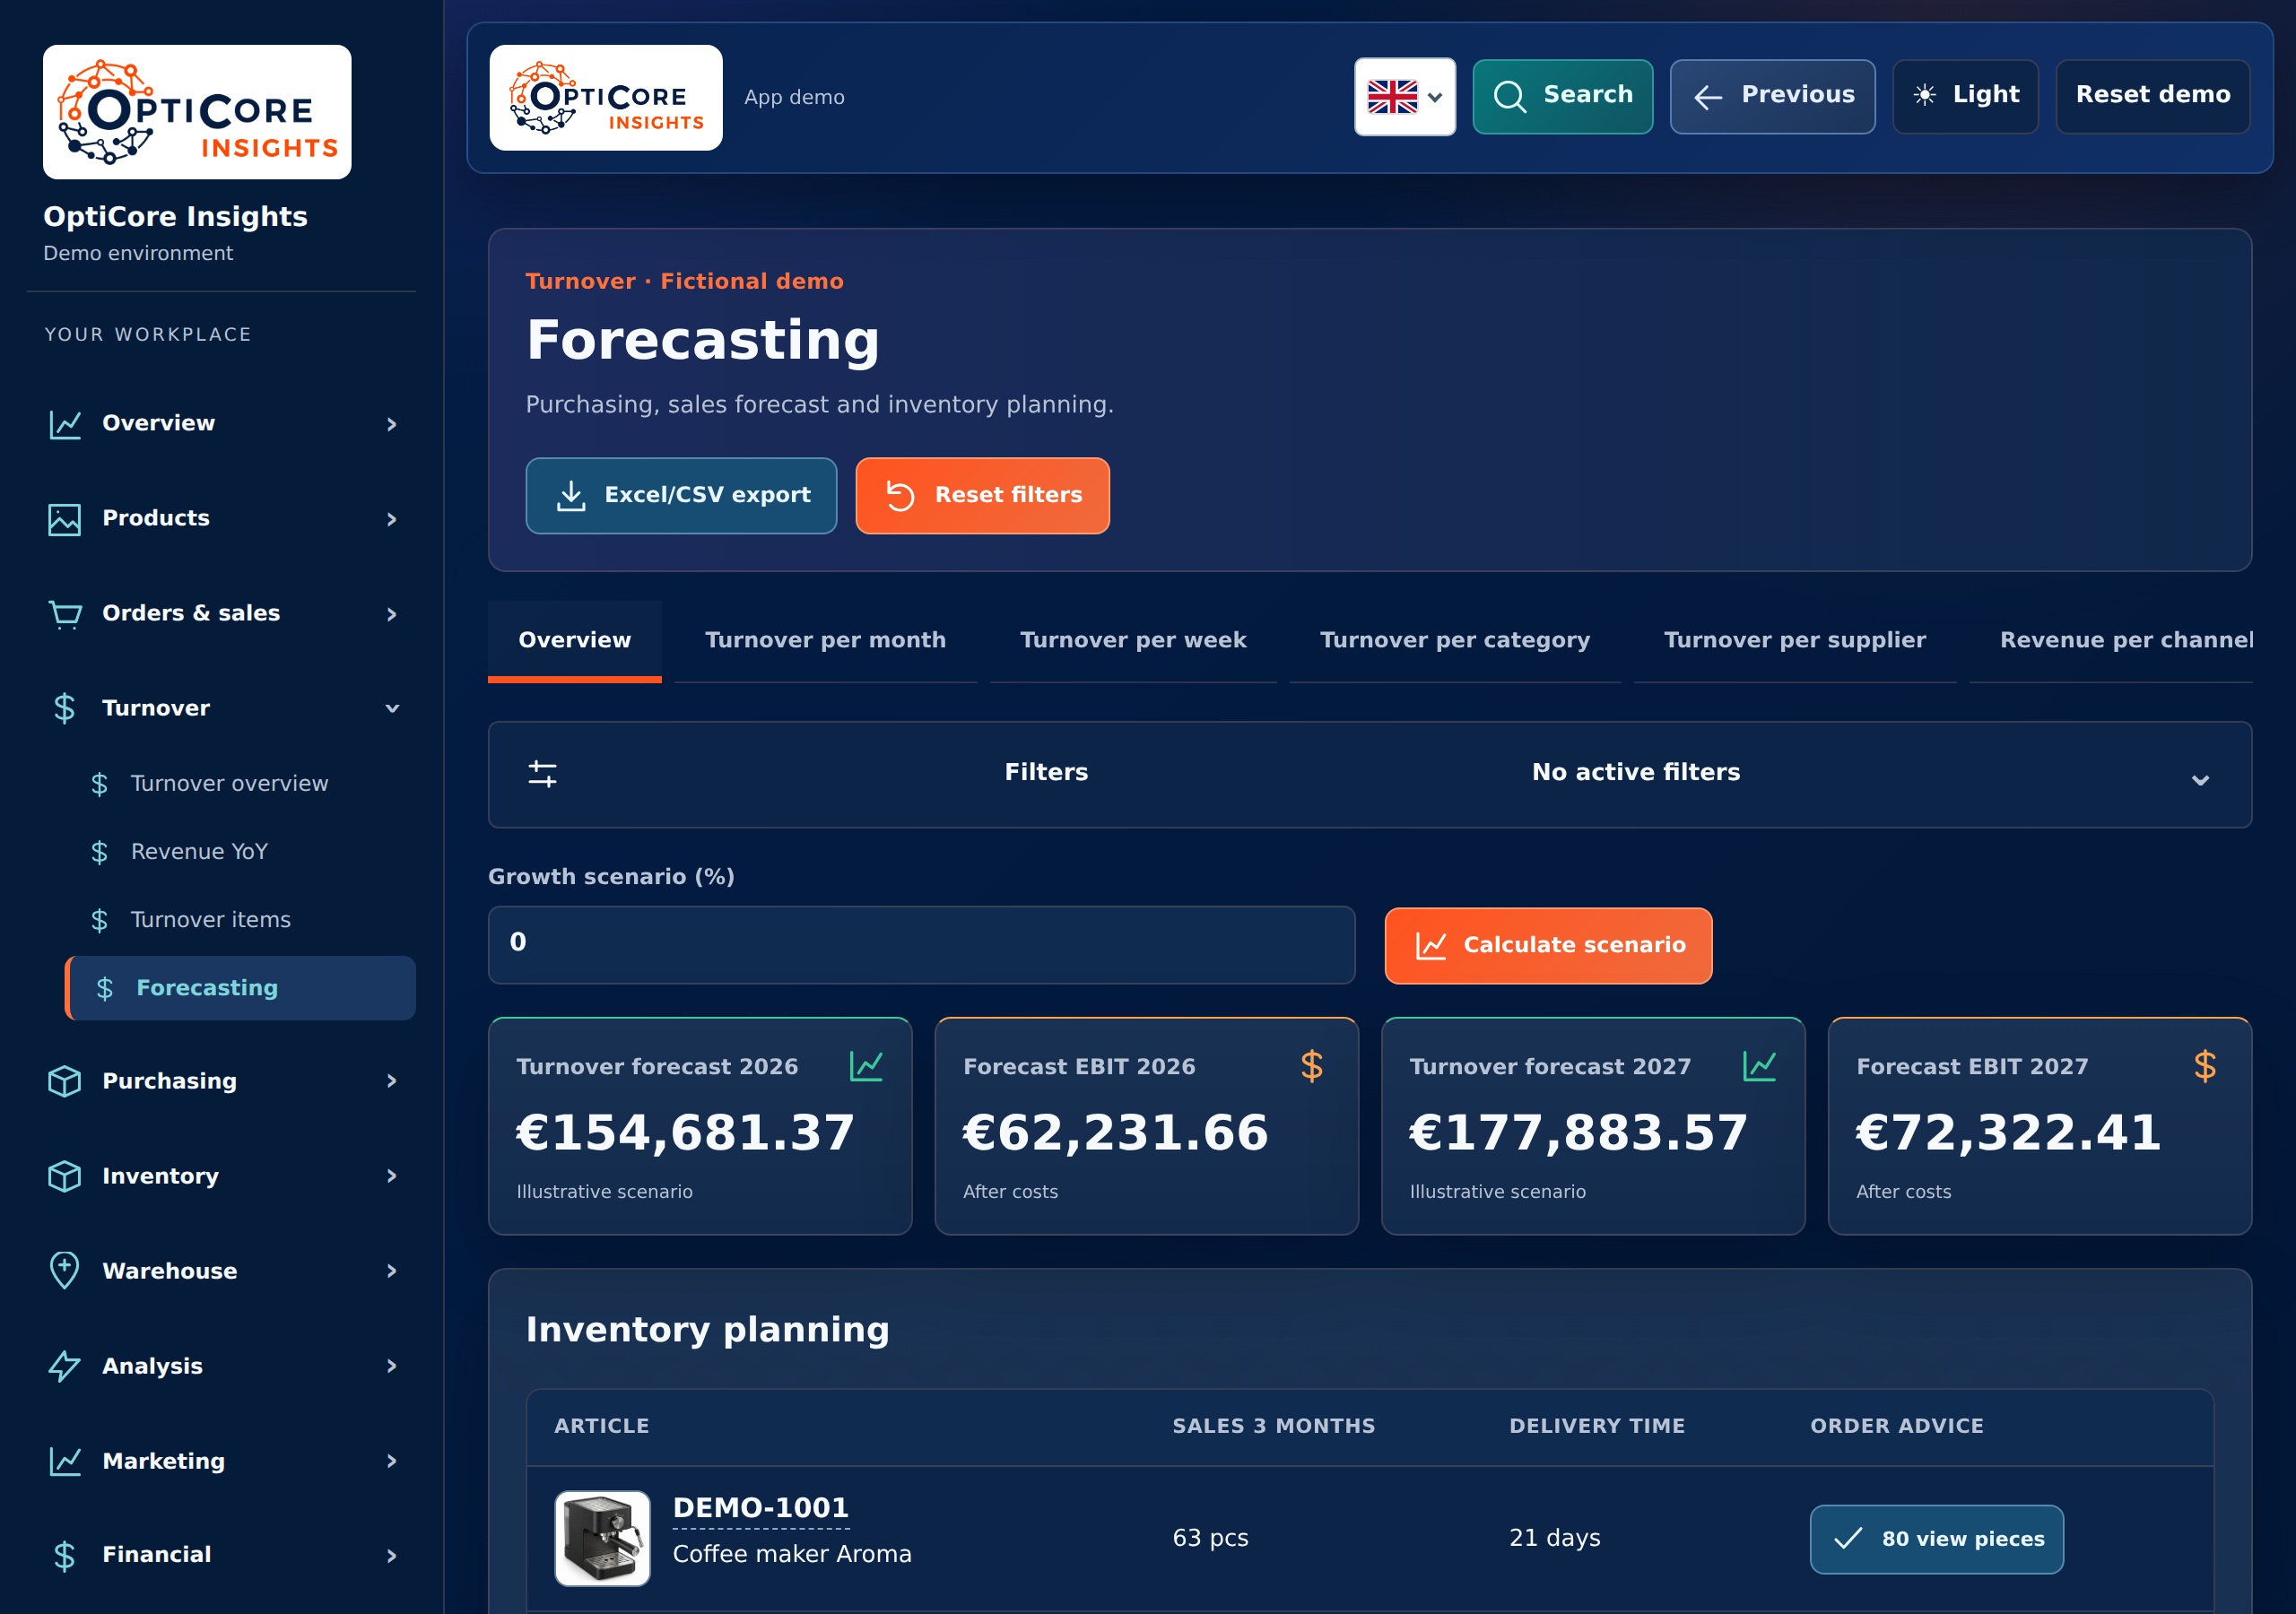
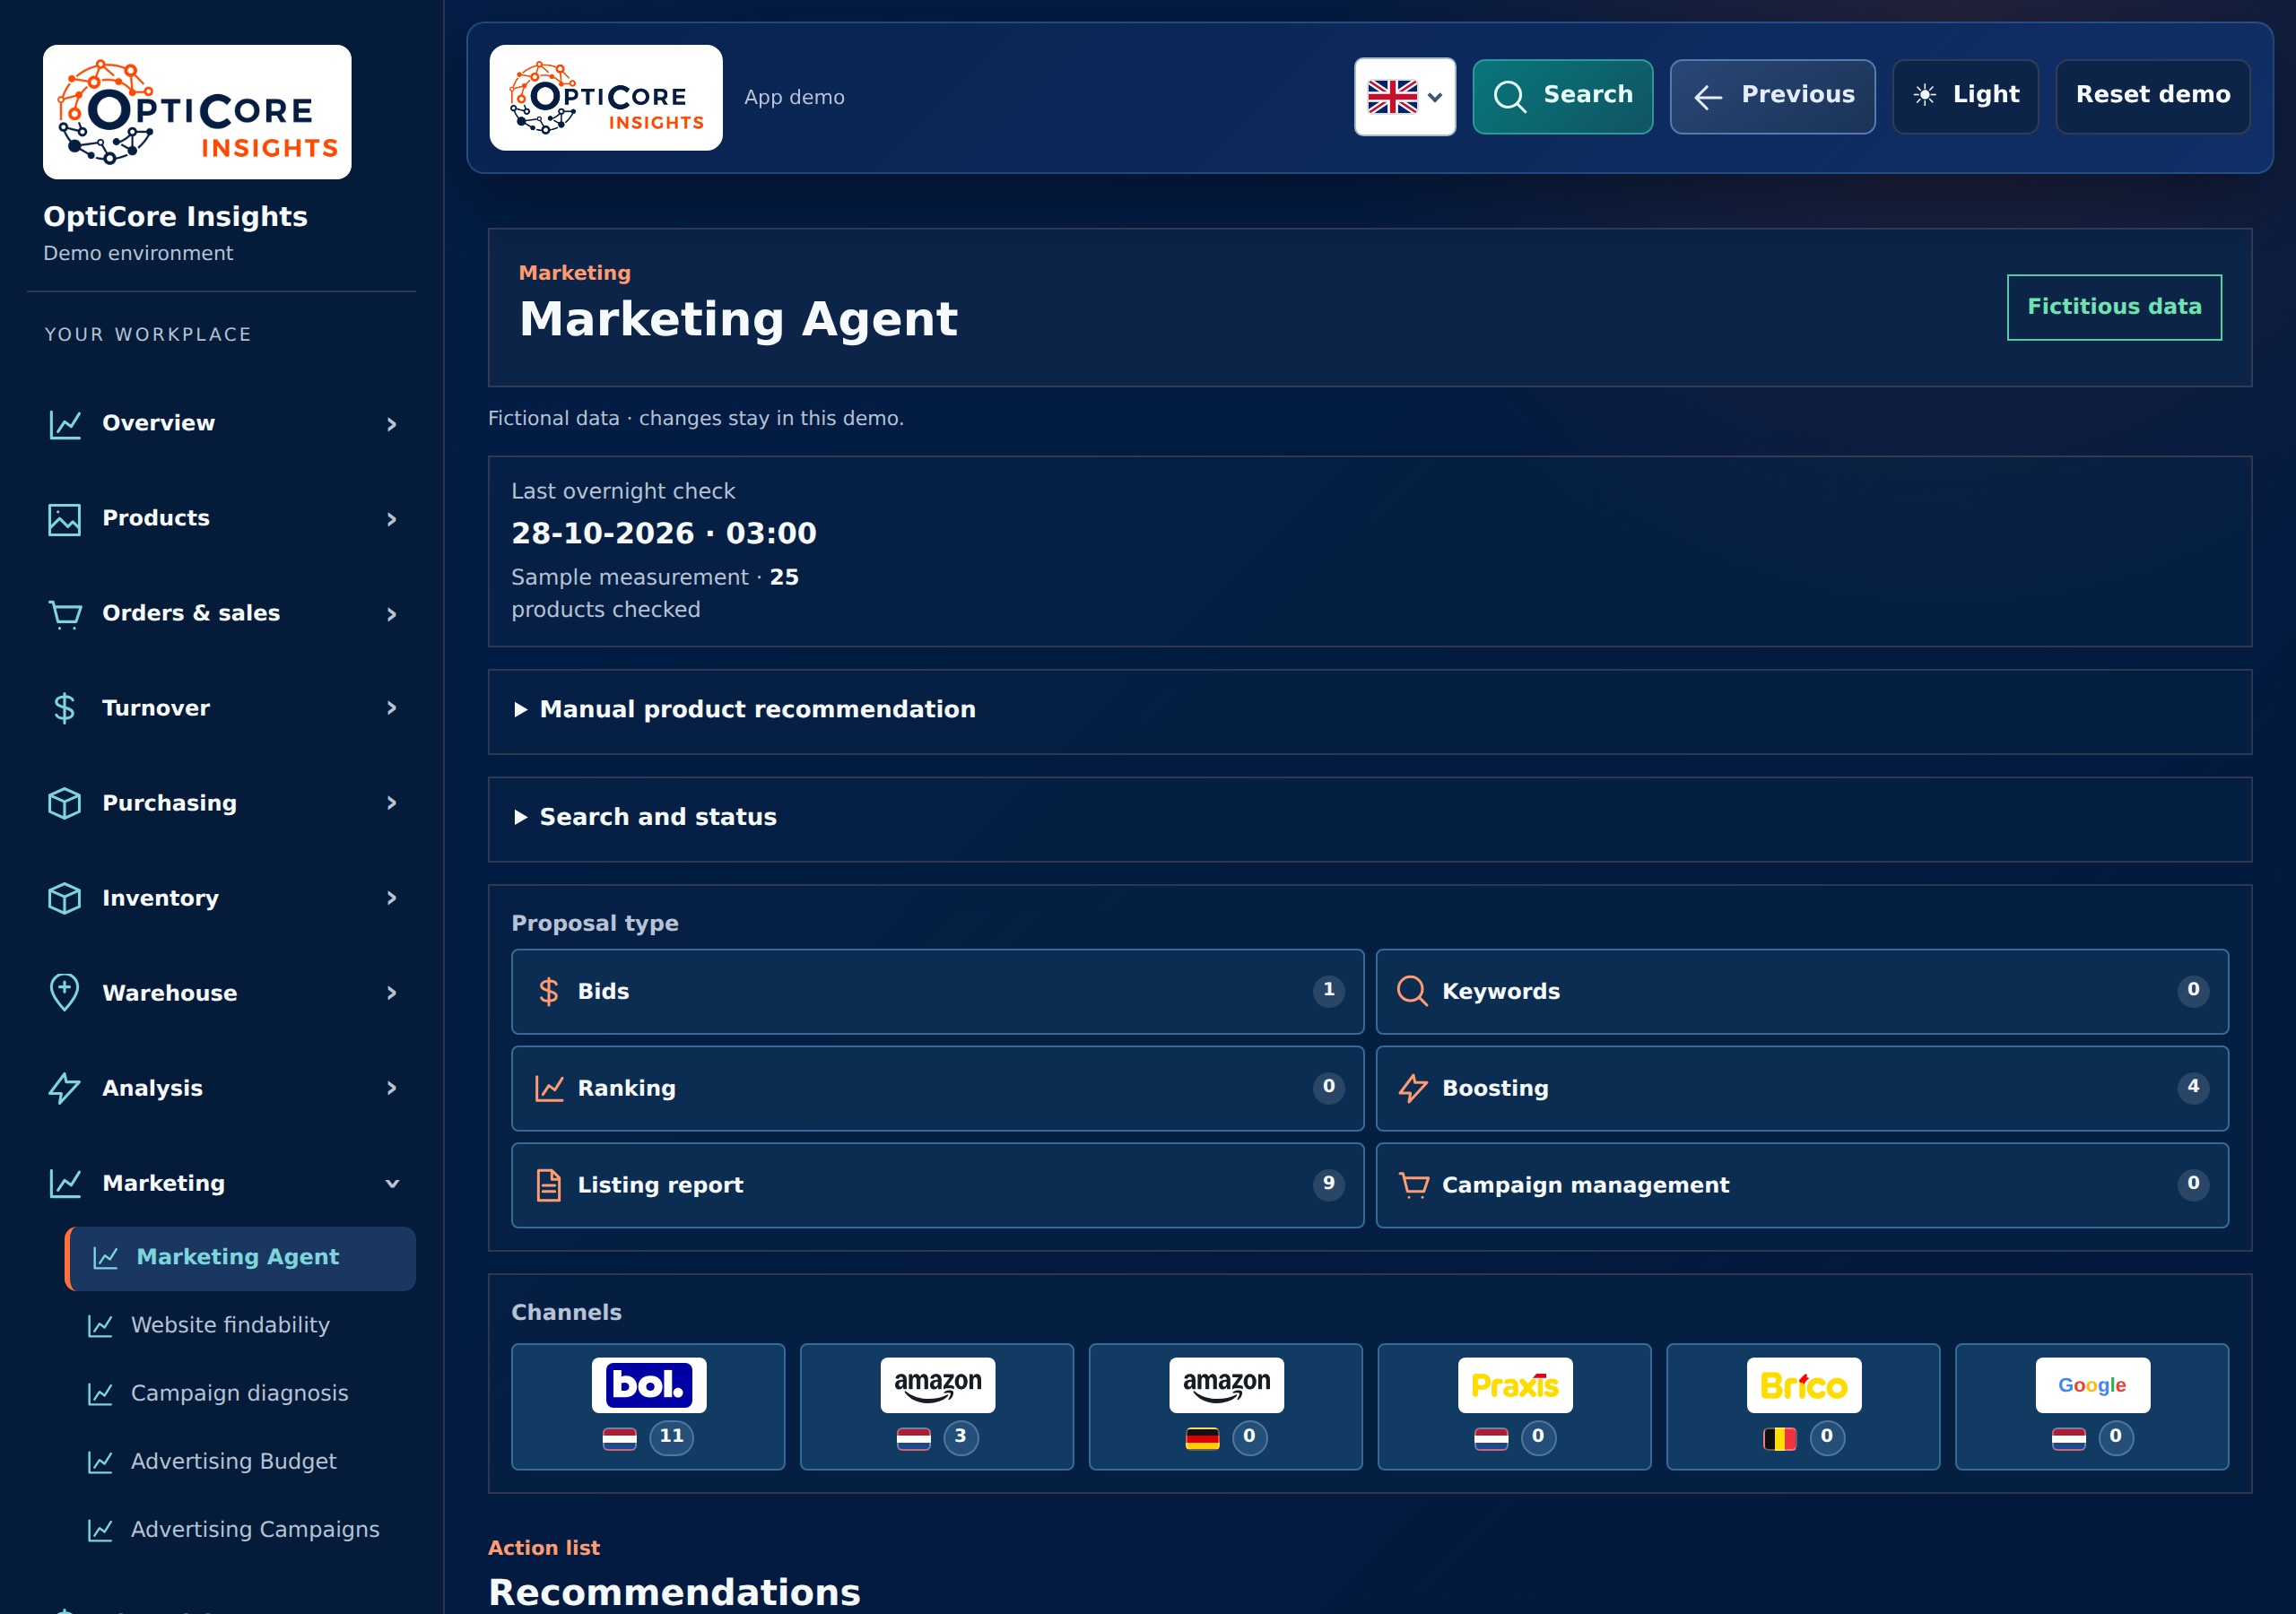
The structure consists of a shared database with a compact management overview and in-depth modules. At the top are the signals for the daily assessment; This is followed by article information, channel performance, stock and forecasting.
This structure prevents all details from having to fit on one screen. You start with the question that requires attention and go from there to the information or action that is needed.
04 · Construction and further development
The dashboard grew along with the operation.
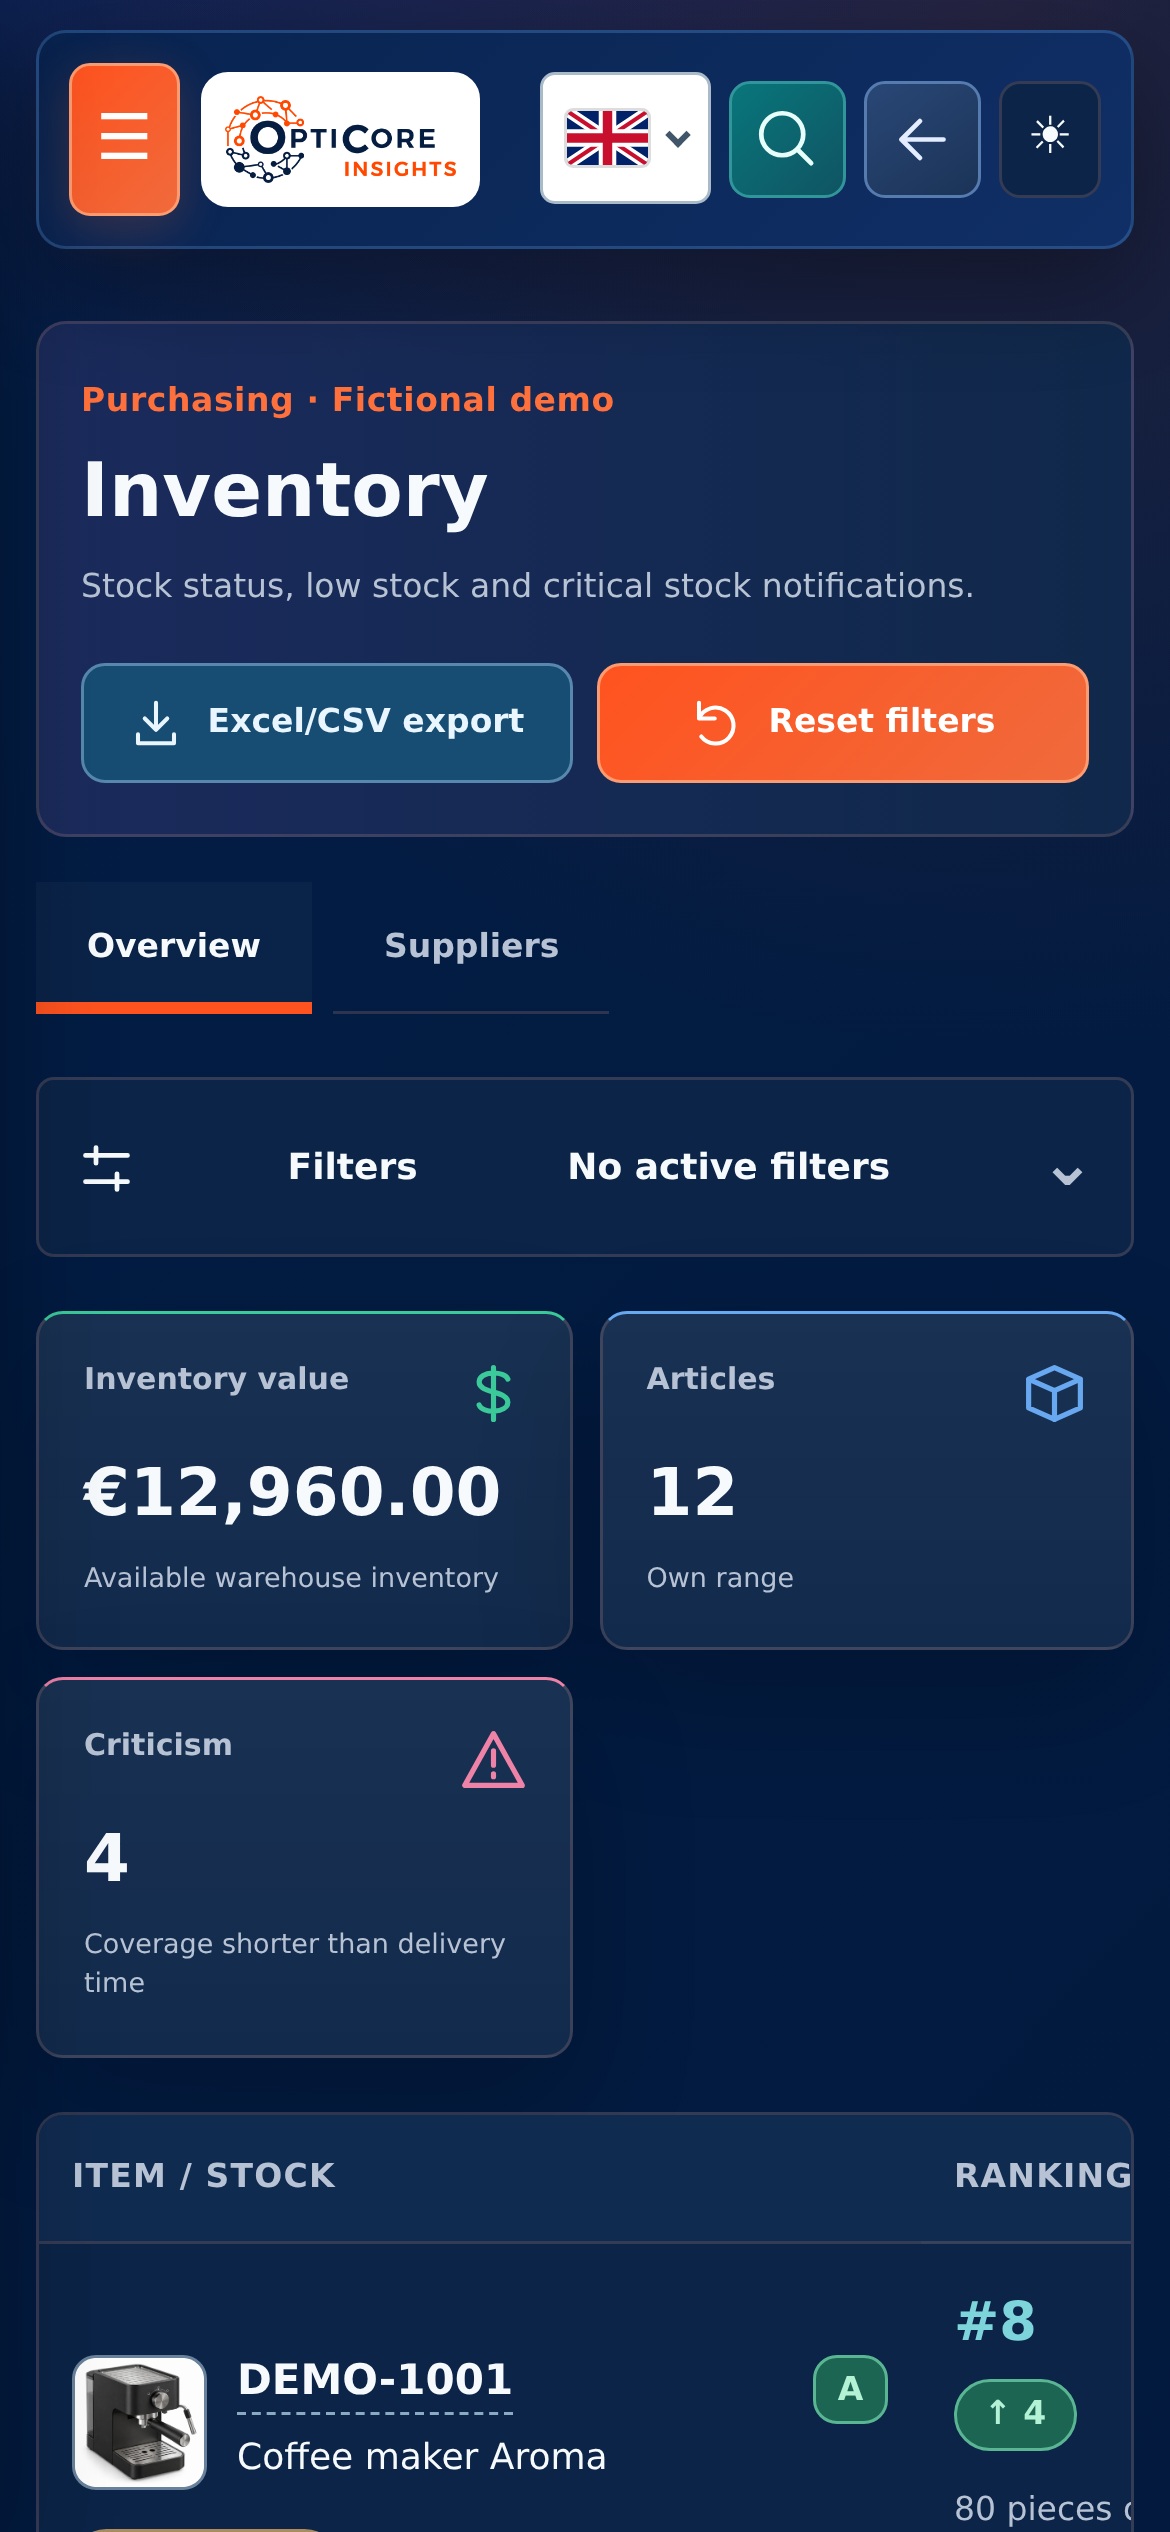
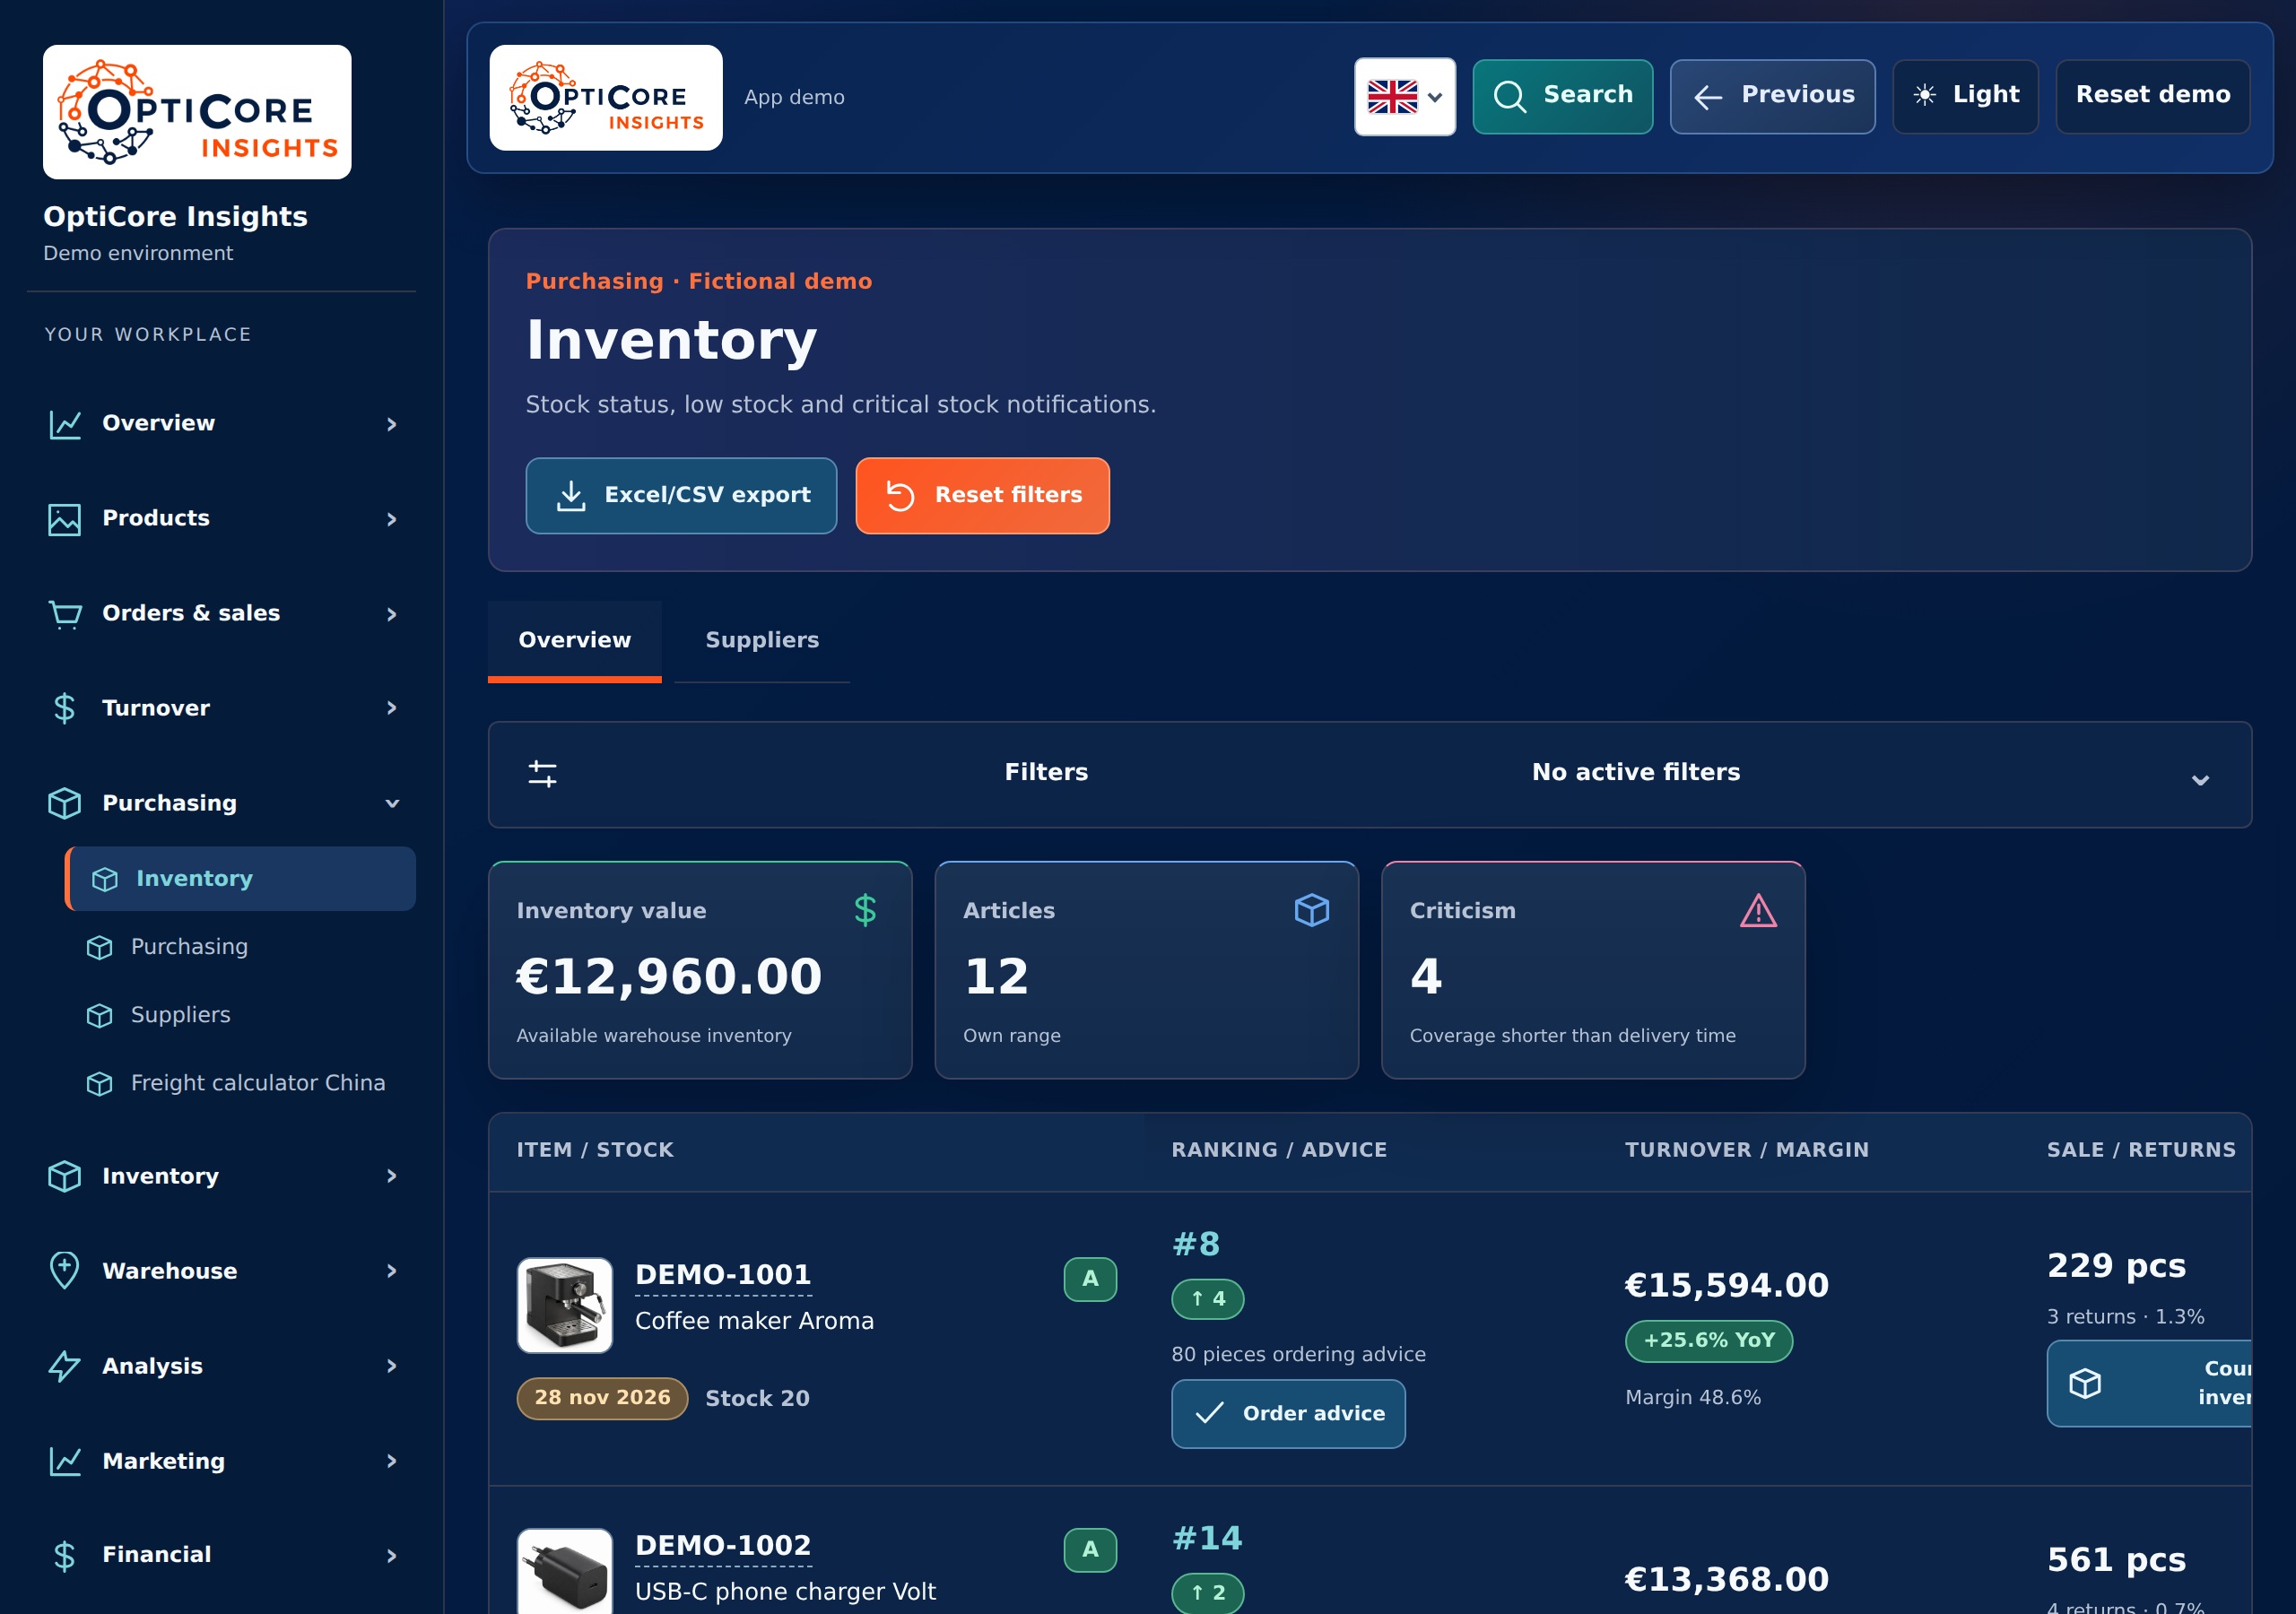
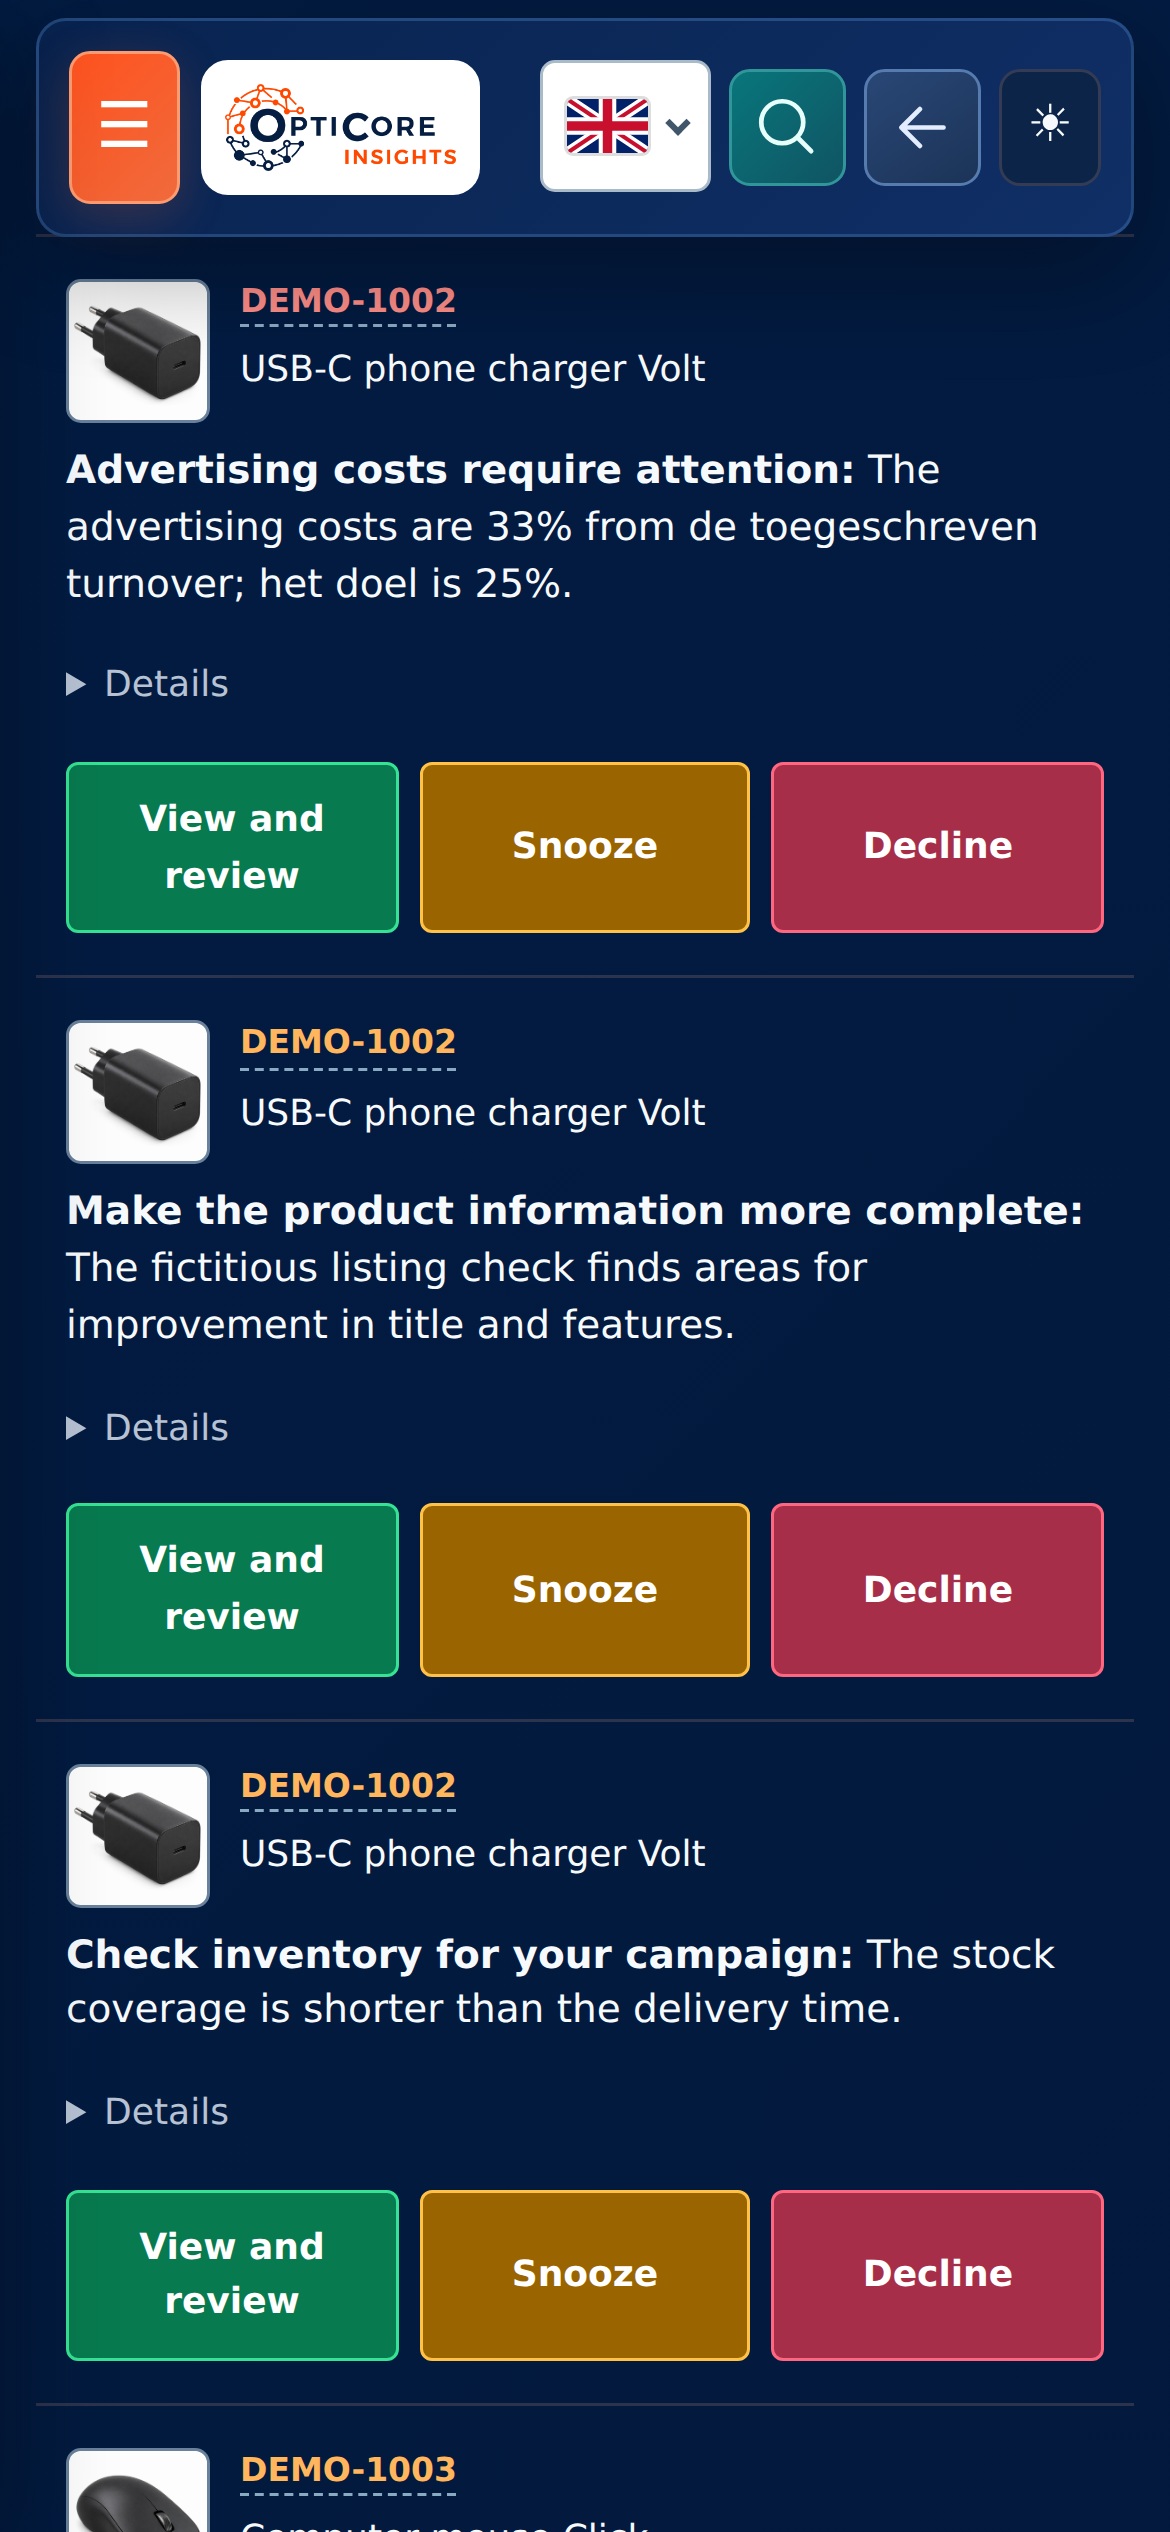
In addition to turnover and result information, modules for stock, order suggestions, marketing control, returns and product data have been developed. For example, a stock list not only provides quantities, but also purchase prices, stock value and context for the purchase.
The further development is also about executive work. Listing images can be prepared in the Product Image Studio and source material can be used for editable manual drafts. Selection aids for thermostats and wireless switches then help present the range.
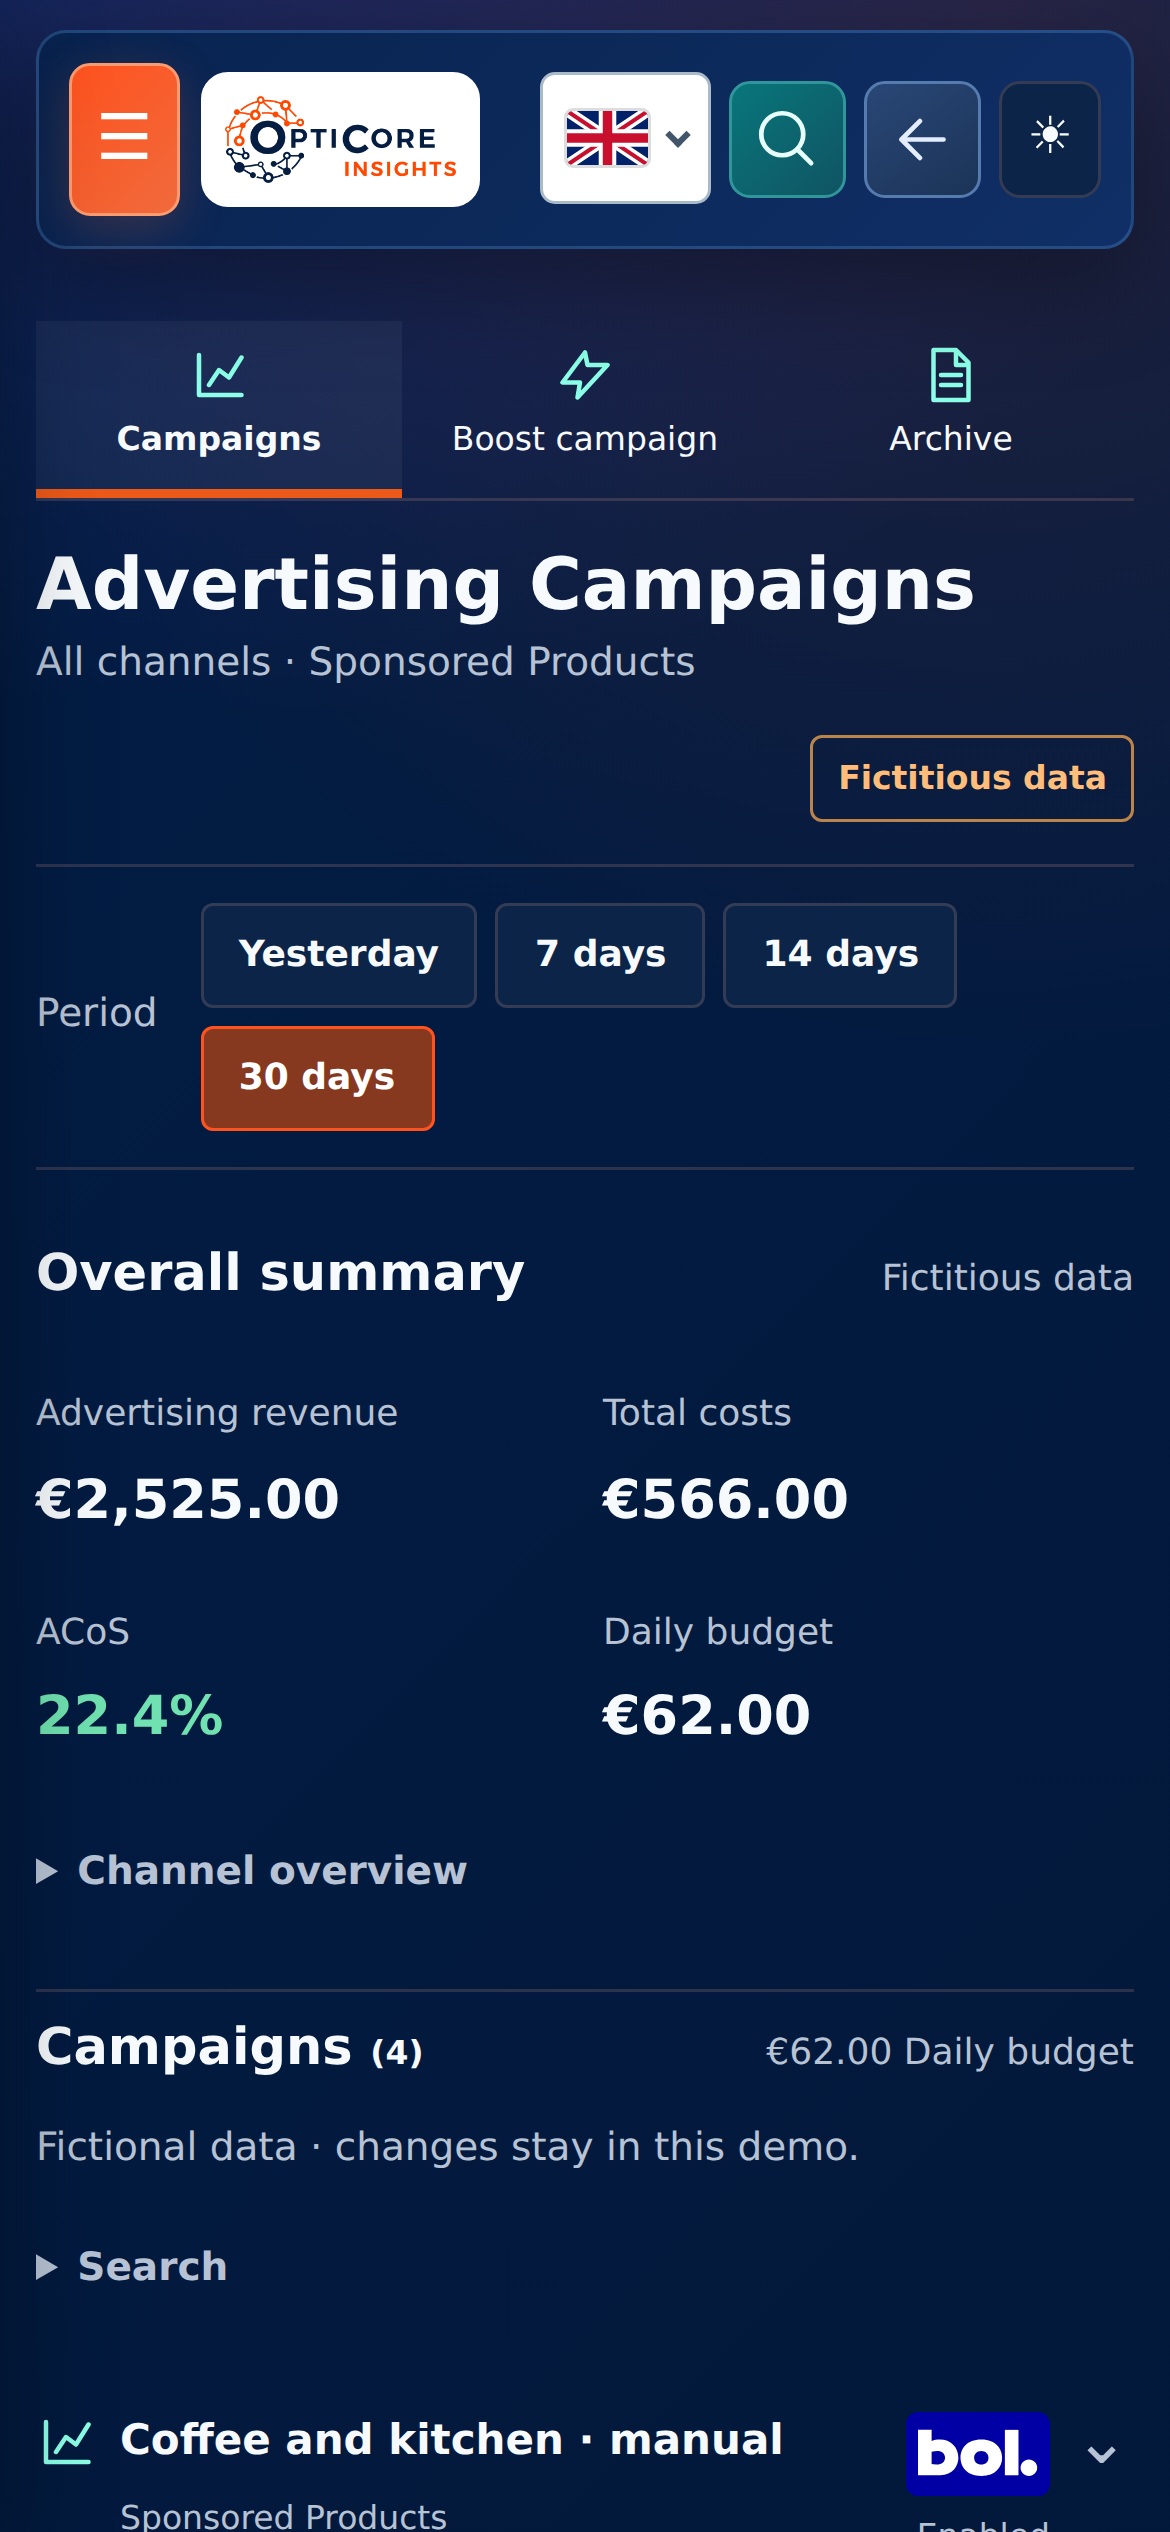
In marketing, advertising costs and revenues via ACoS and TACoS are viewed in proportion. For purchasing, a freight calculator provides additional context on transport options and freight costs per item. This way, commercial and operational choices can be prepared from the same information.
Further development in October 2026
All sales channels remain visible for an item, even without turnover. Offer setup and perceived publication status are addressed separately. Targeted channel changes require checking the article and are read back after implementation.
The purchasing workplace keeps track of individual orders, partial receipts and attachments. In the event of an uncertain stock update, an assessment is made first, so that a receipt is not blindly processed again. Read the update on sales and purchasing →
From insight to the next step
What you can do from the overview
| Reason | What you see | The next action |
|---|---|---|
| Stock or availability requires attention | View item details, quantities and stock value. | Continue to item analysis and review an order suggestion. |
| Turnover is growing, results are lagging behind | Compare margin, returns and advertising ratio. | Investigate the channel or article in question specifically and adjust the approach. |
| Product presentation could be better | Existing product data and images together. | Prepare and review listing images or a manual draft. |
05 · Implementation
Links, processing and control together.
The application is built with Python, FastAPI, PostgreSQL and API links. Data is processed into a useful common basis, after which the screens use the same item and period context.
Background processing remains visible through job statuses and logs. A malfunction in a connection is therefore part of the workplace: you can first investigate the cause before basing a decision on incomplete figures.
06 · Testing and checking
A nice graph must be correct in terms of content.
The relevant checks are on the correlation between turnover, margin, channel and period. Comparisons with the previous year and forecasts require extra attention: a forecast is an estimate and must remain recognizable next to the actually achieved figures.
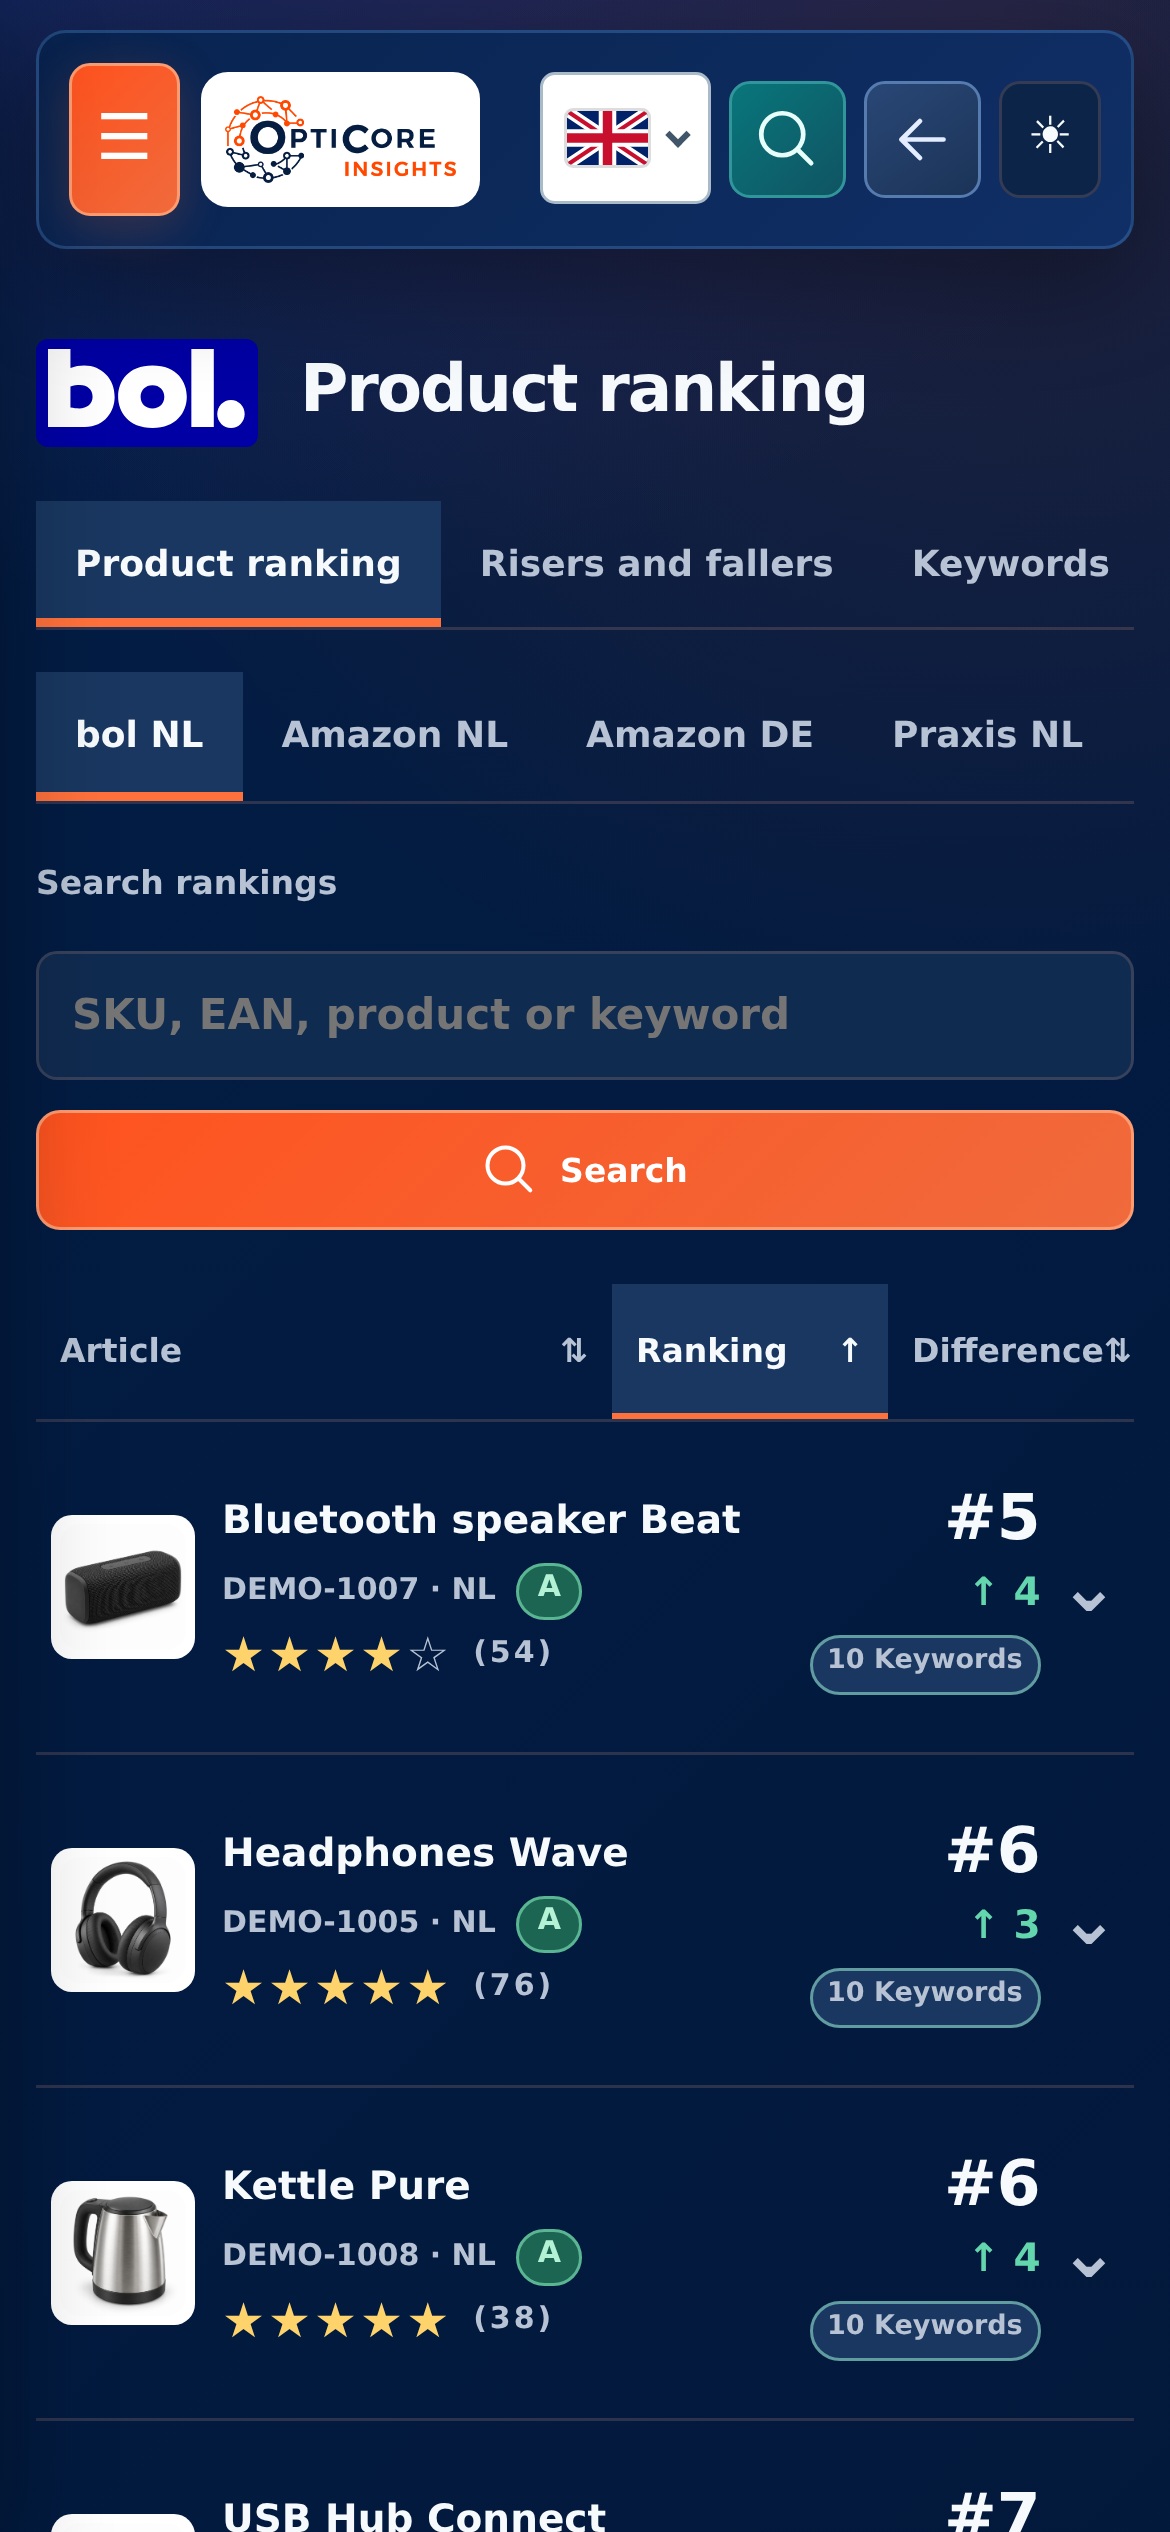
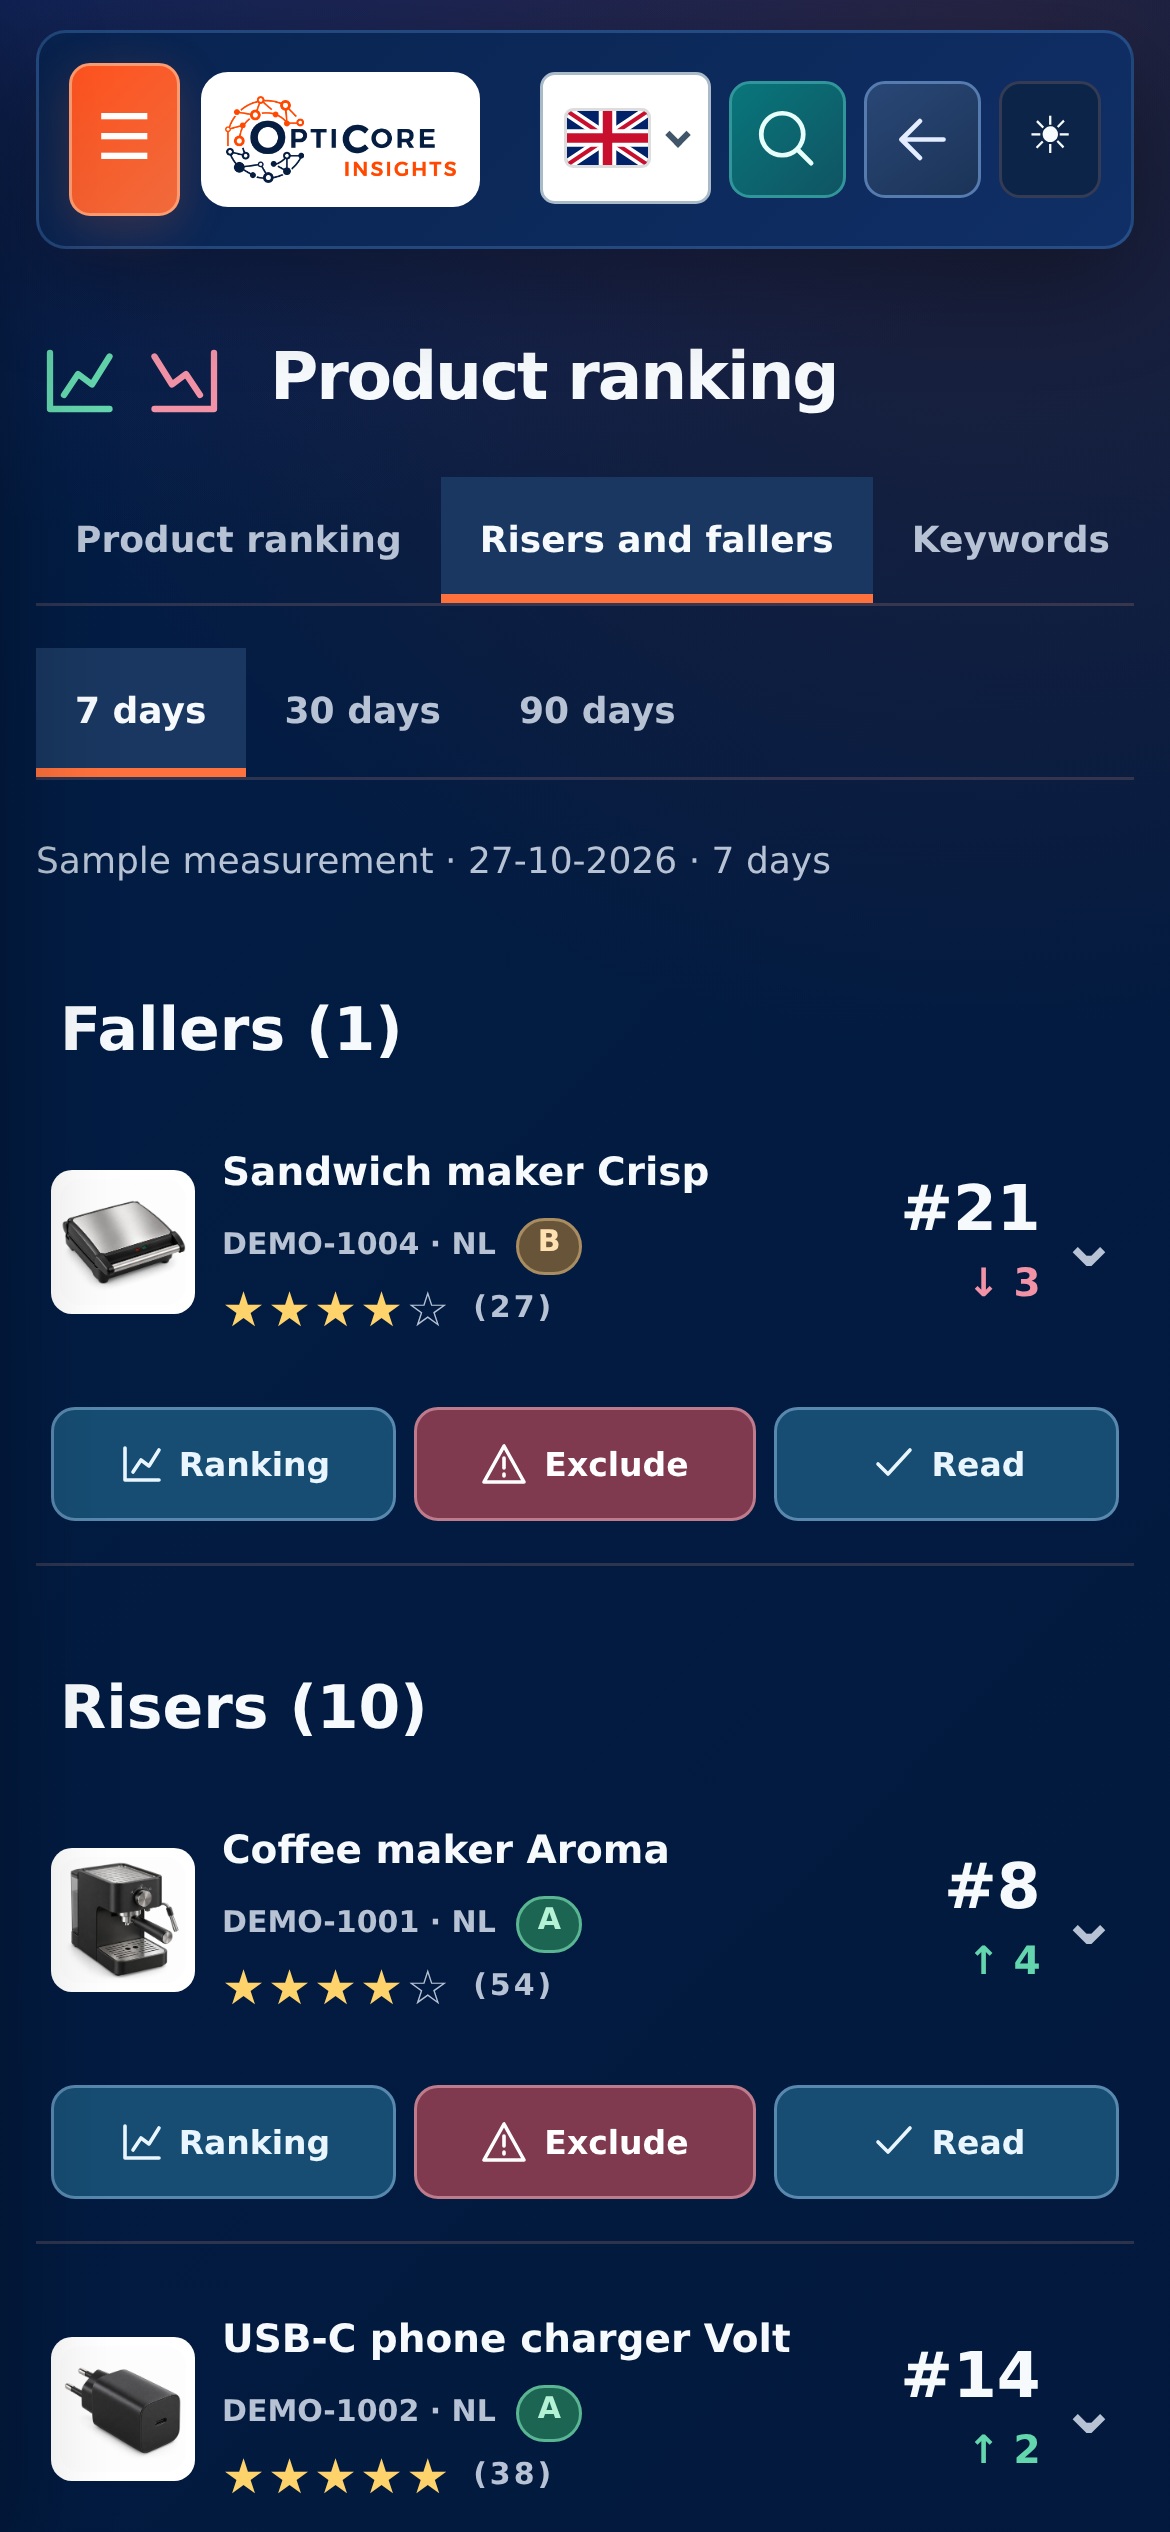
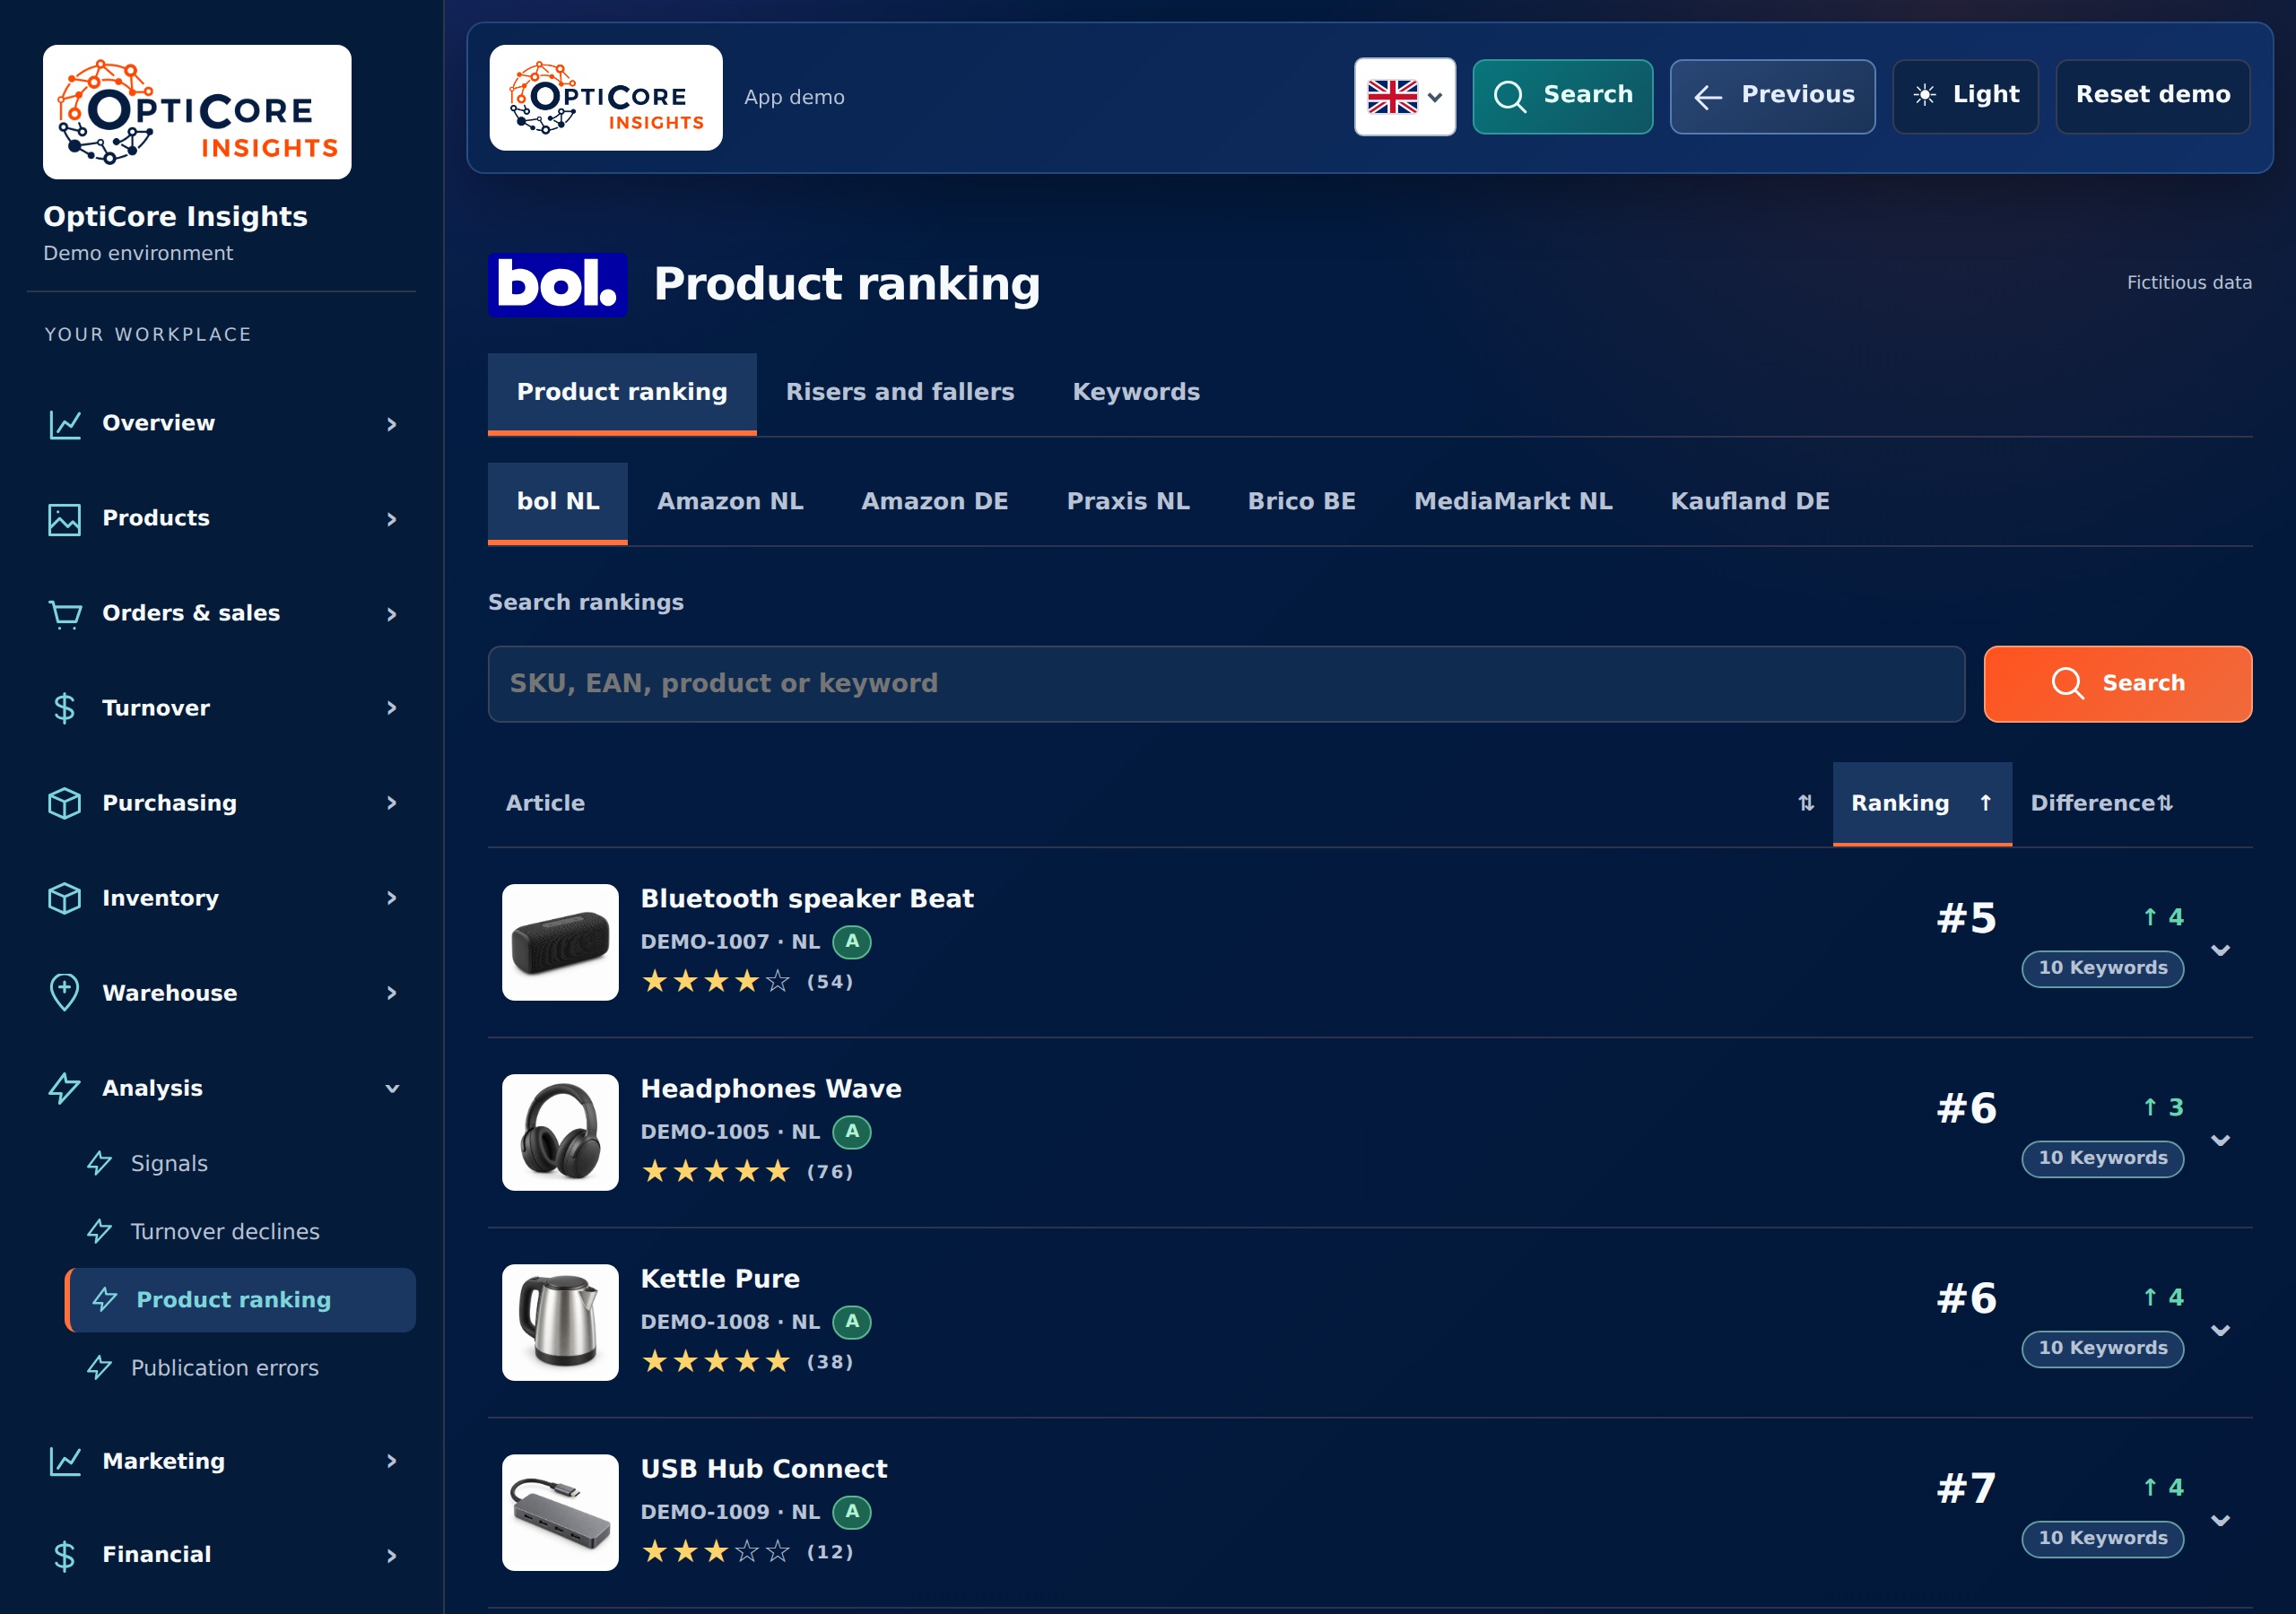
Control is equally important for the executive modules. Content and purchasing concepts require review before they are followed up. The previews on this page use a neutral design and completely fictional data. They show how numbers and next steps come together.
07 · Delivery
A workplace for recurring decisions.
The result is a dashboard with in-depth screens and operational tools. This makes the delivery more than a periodic report: the same environment supports viewing, researching and preparing follow-up work.
New questions can be worked on in their own module without making the first overview increasingly full. This keeps the daily start clear and leaves room for further development.
08 · Time savings and insight
Where the profit is in this project
The benefit lies in less collecting and switching, with more context for the decision. How much time this saves depends on the number of channels, articles and checks. We will not publish unconfirmed hours or percentages for this case.
Collect less
The daily assessment starts with a joint overview instead of individual exports per sales channel.
More targeted purchasing work
Stock information and order suggestions support the preparation; the assessment remains with the user.
Shorter route to implementation
A point of interest can be followed to article information, content or an operational work module.
What difference would a shorter work step make to you?
Enter your own times for one recurring action. This is a calculation tool, not a measured result of this project.
The annual calculation uses 52 weeks. The actual savings depends on your process and the control required.
See also
View the ranking tool, marketing agent and forecasting for bol entrepreneurs →