

Clear communication
We make agreements easy to understand and keep you informed about progress, decisions and next steps.
Explanation and possibilities
An analysis helps understand where a difference comes from. For example, why the margin changes or which products determine the stock value.
We start with the question and then check the available resources. The outcome is reduced to an overview, comparison or calculation with which you can proceed in a targeted manner.
In pictures · Smartlife Domotica
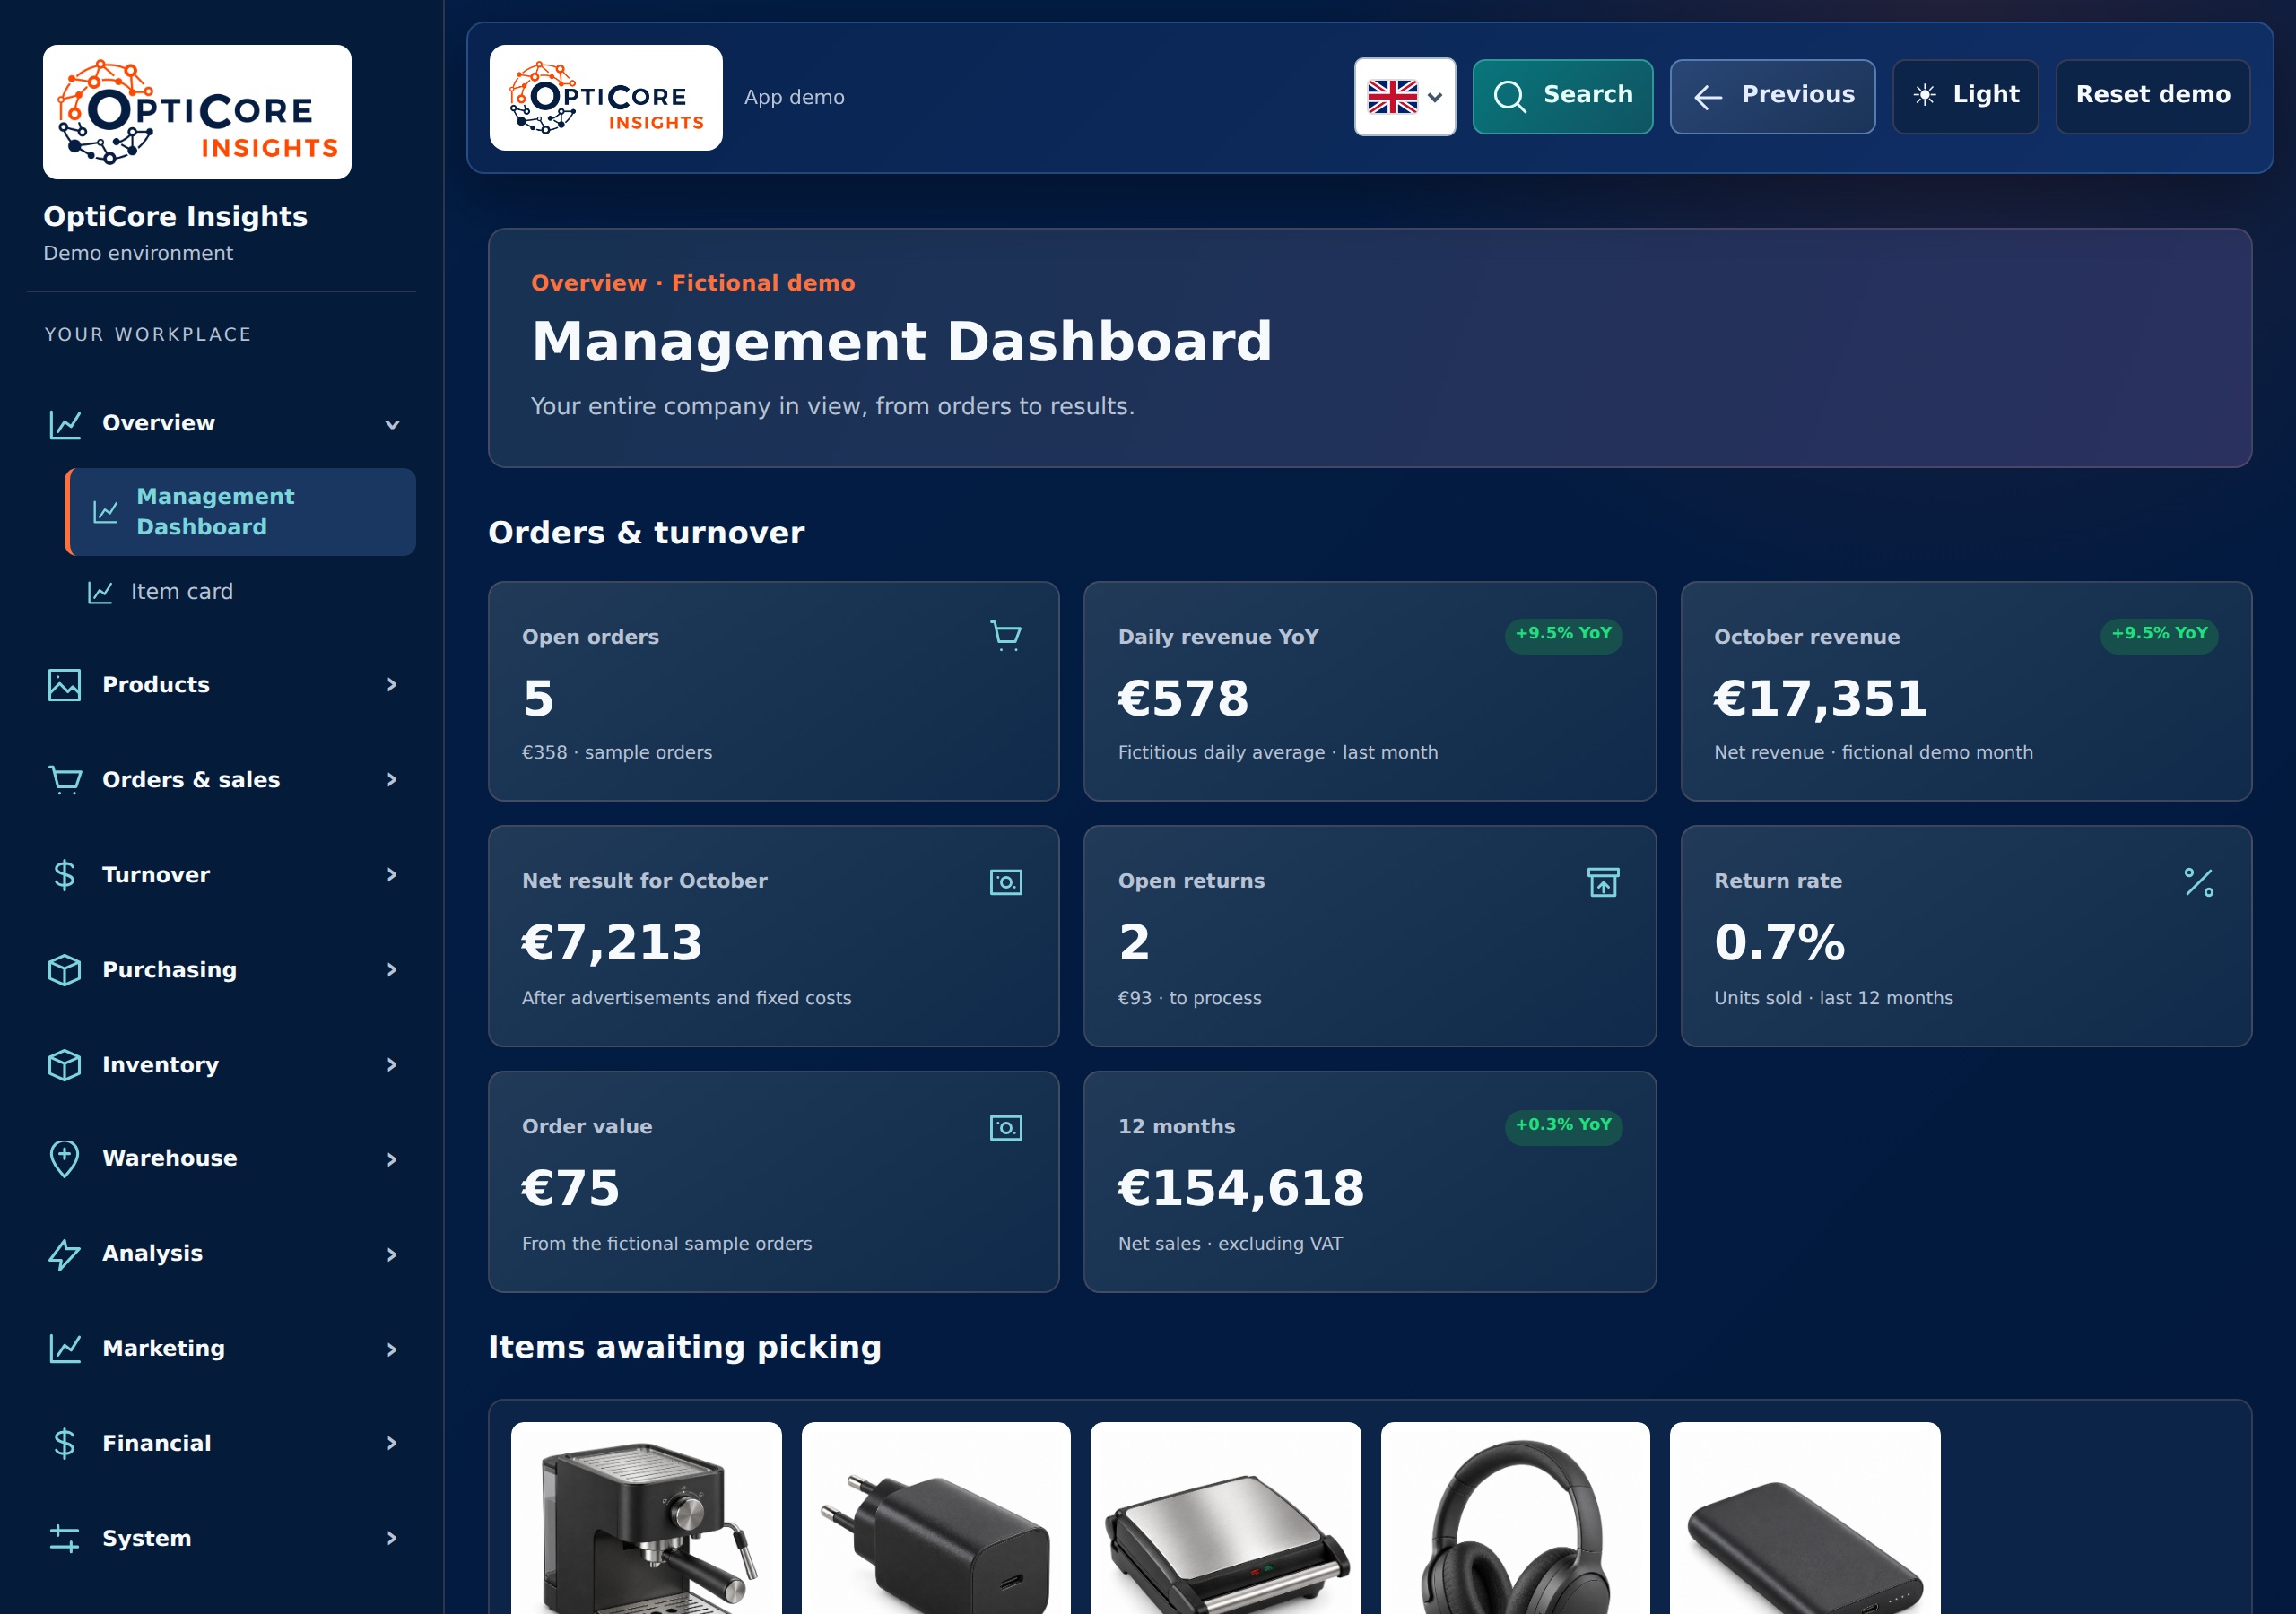
Lower turnover does not yet tell us where the problem lies. This dashboard compares developments to previous periods and brings together information about items, stock and marketing.
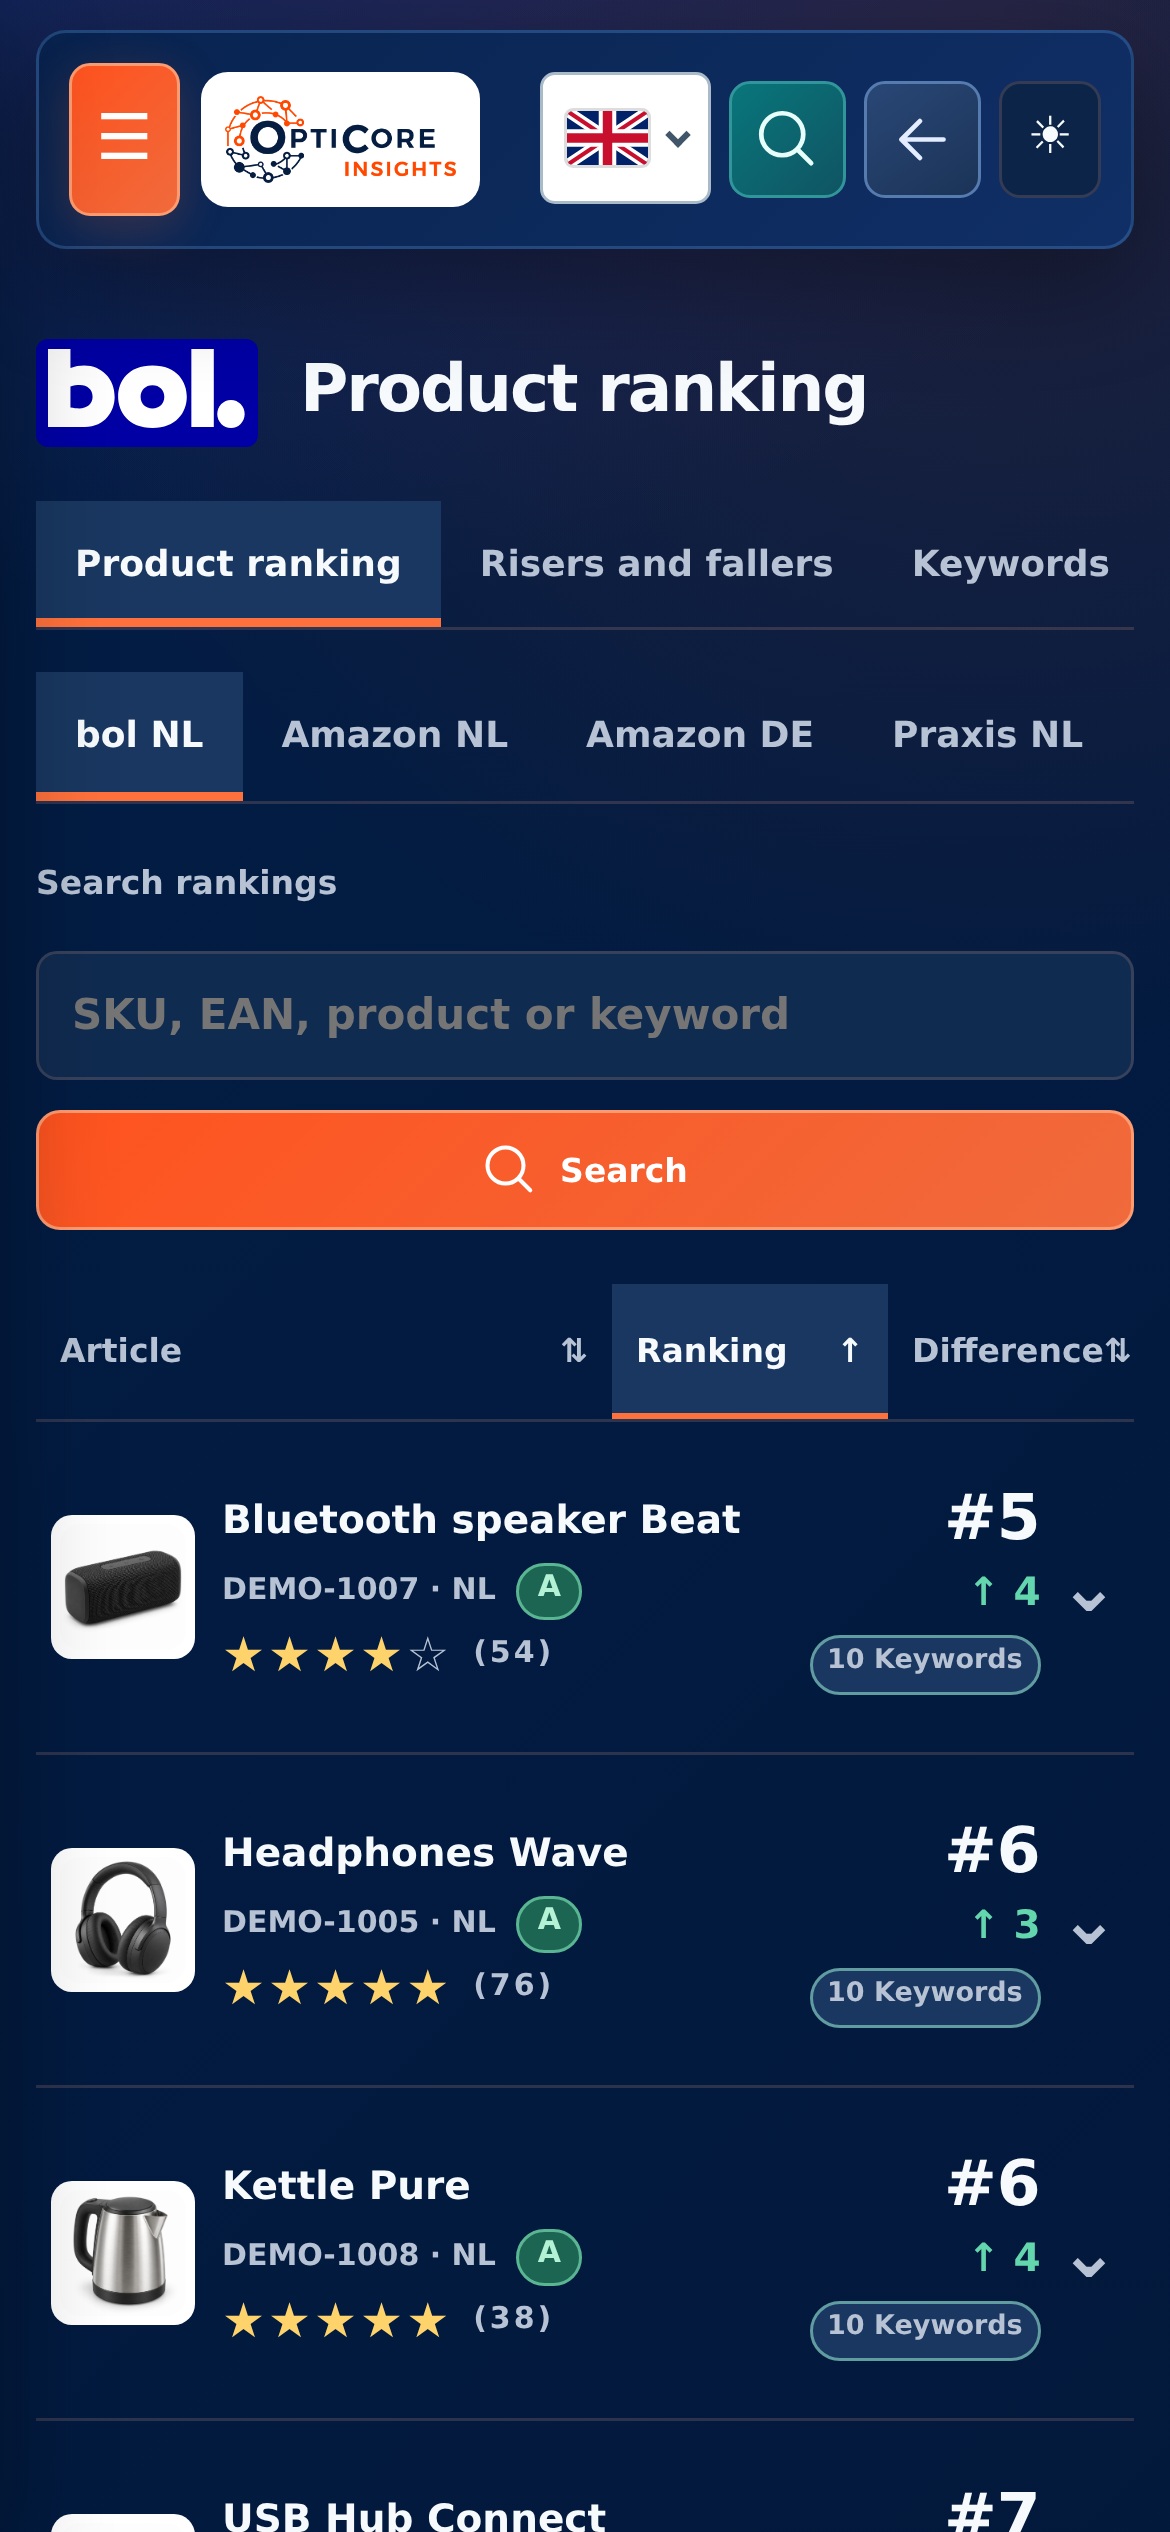
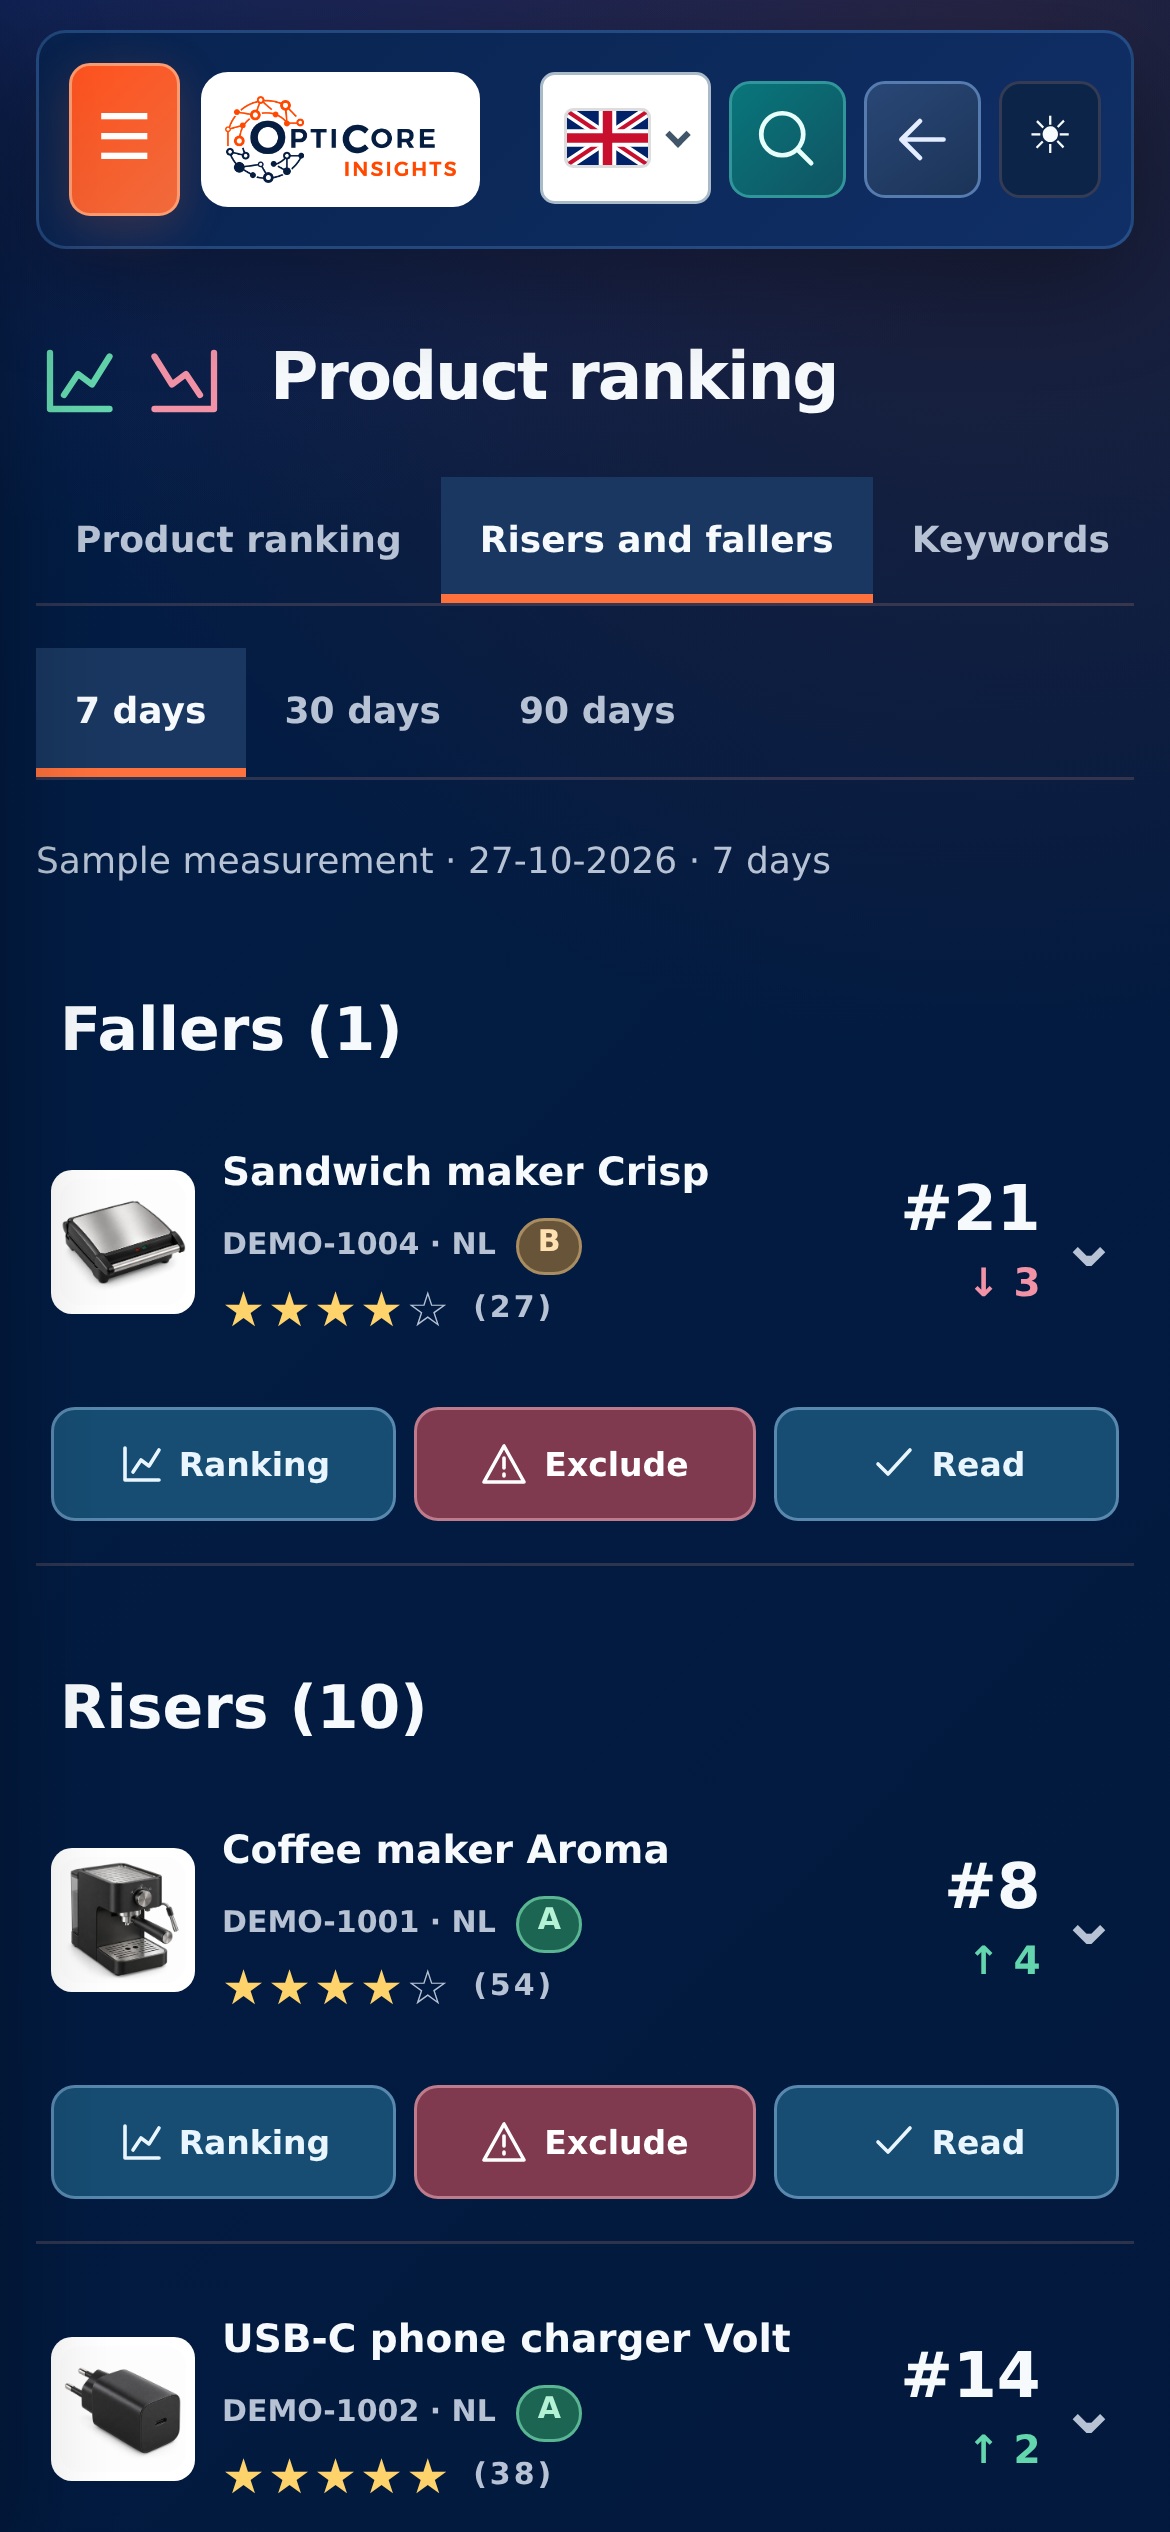
You can investigate an anomaly and understand the context. Does the visibility of a keyword change, or can an article not be delivered properly? That determines which next step makes sense.
View the project and approach →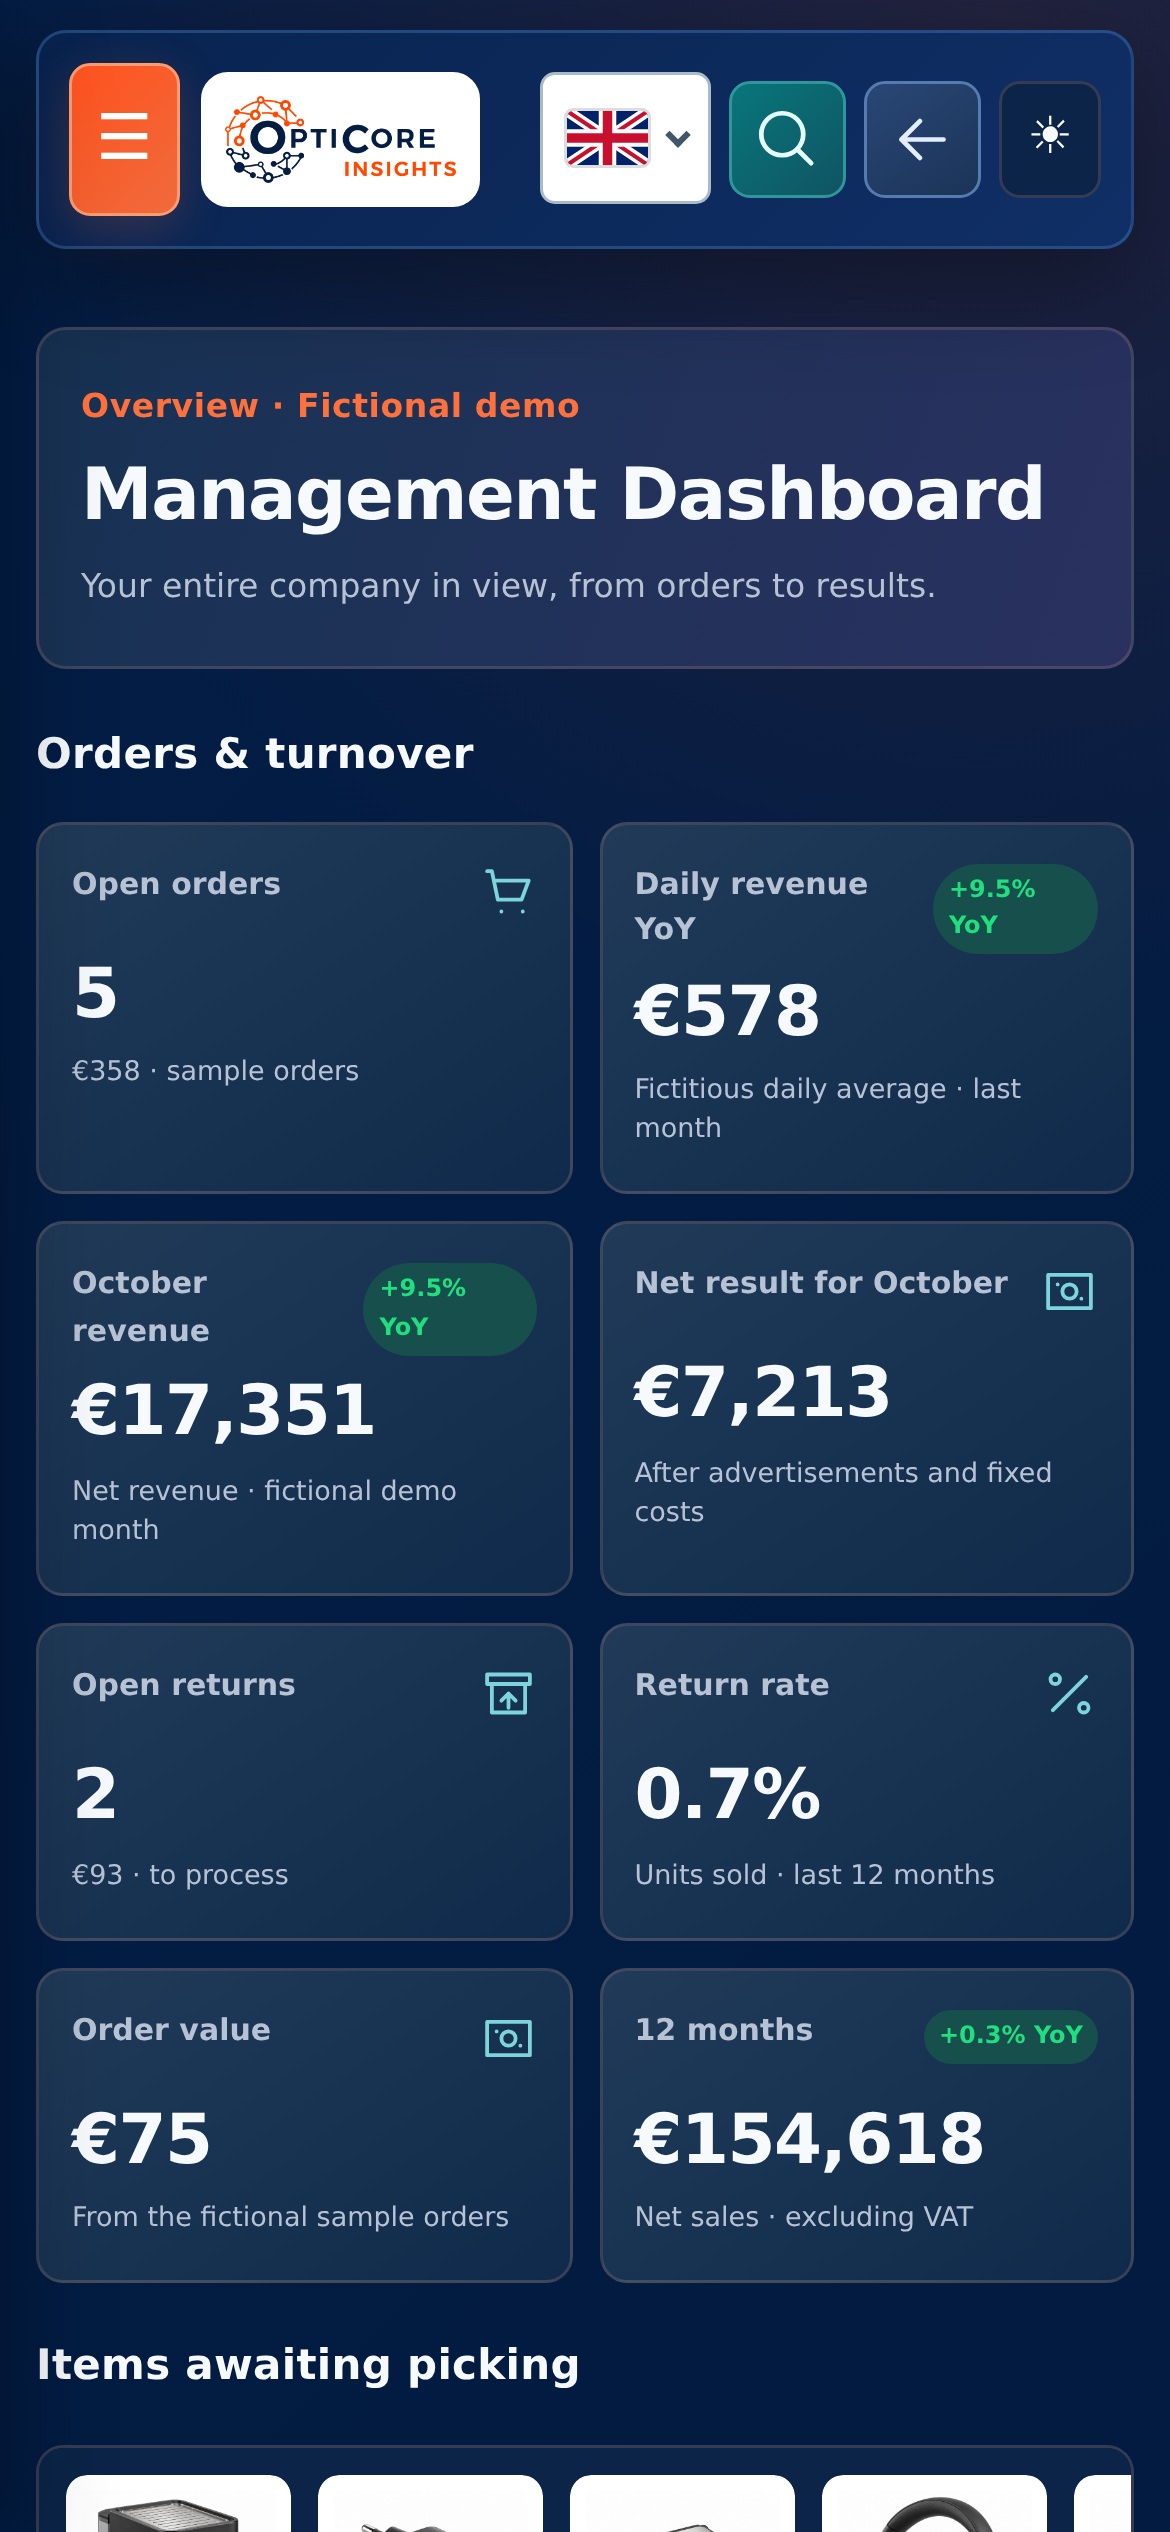
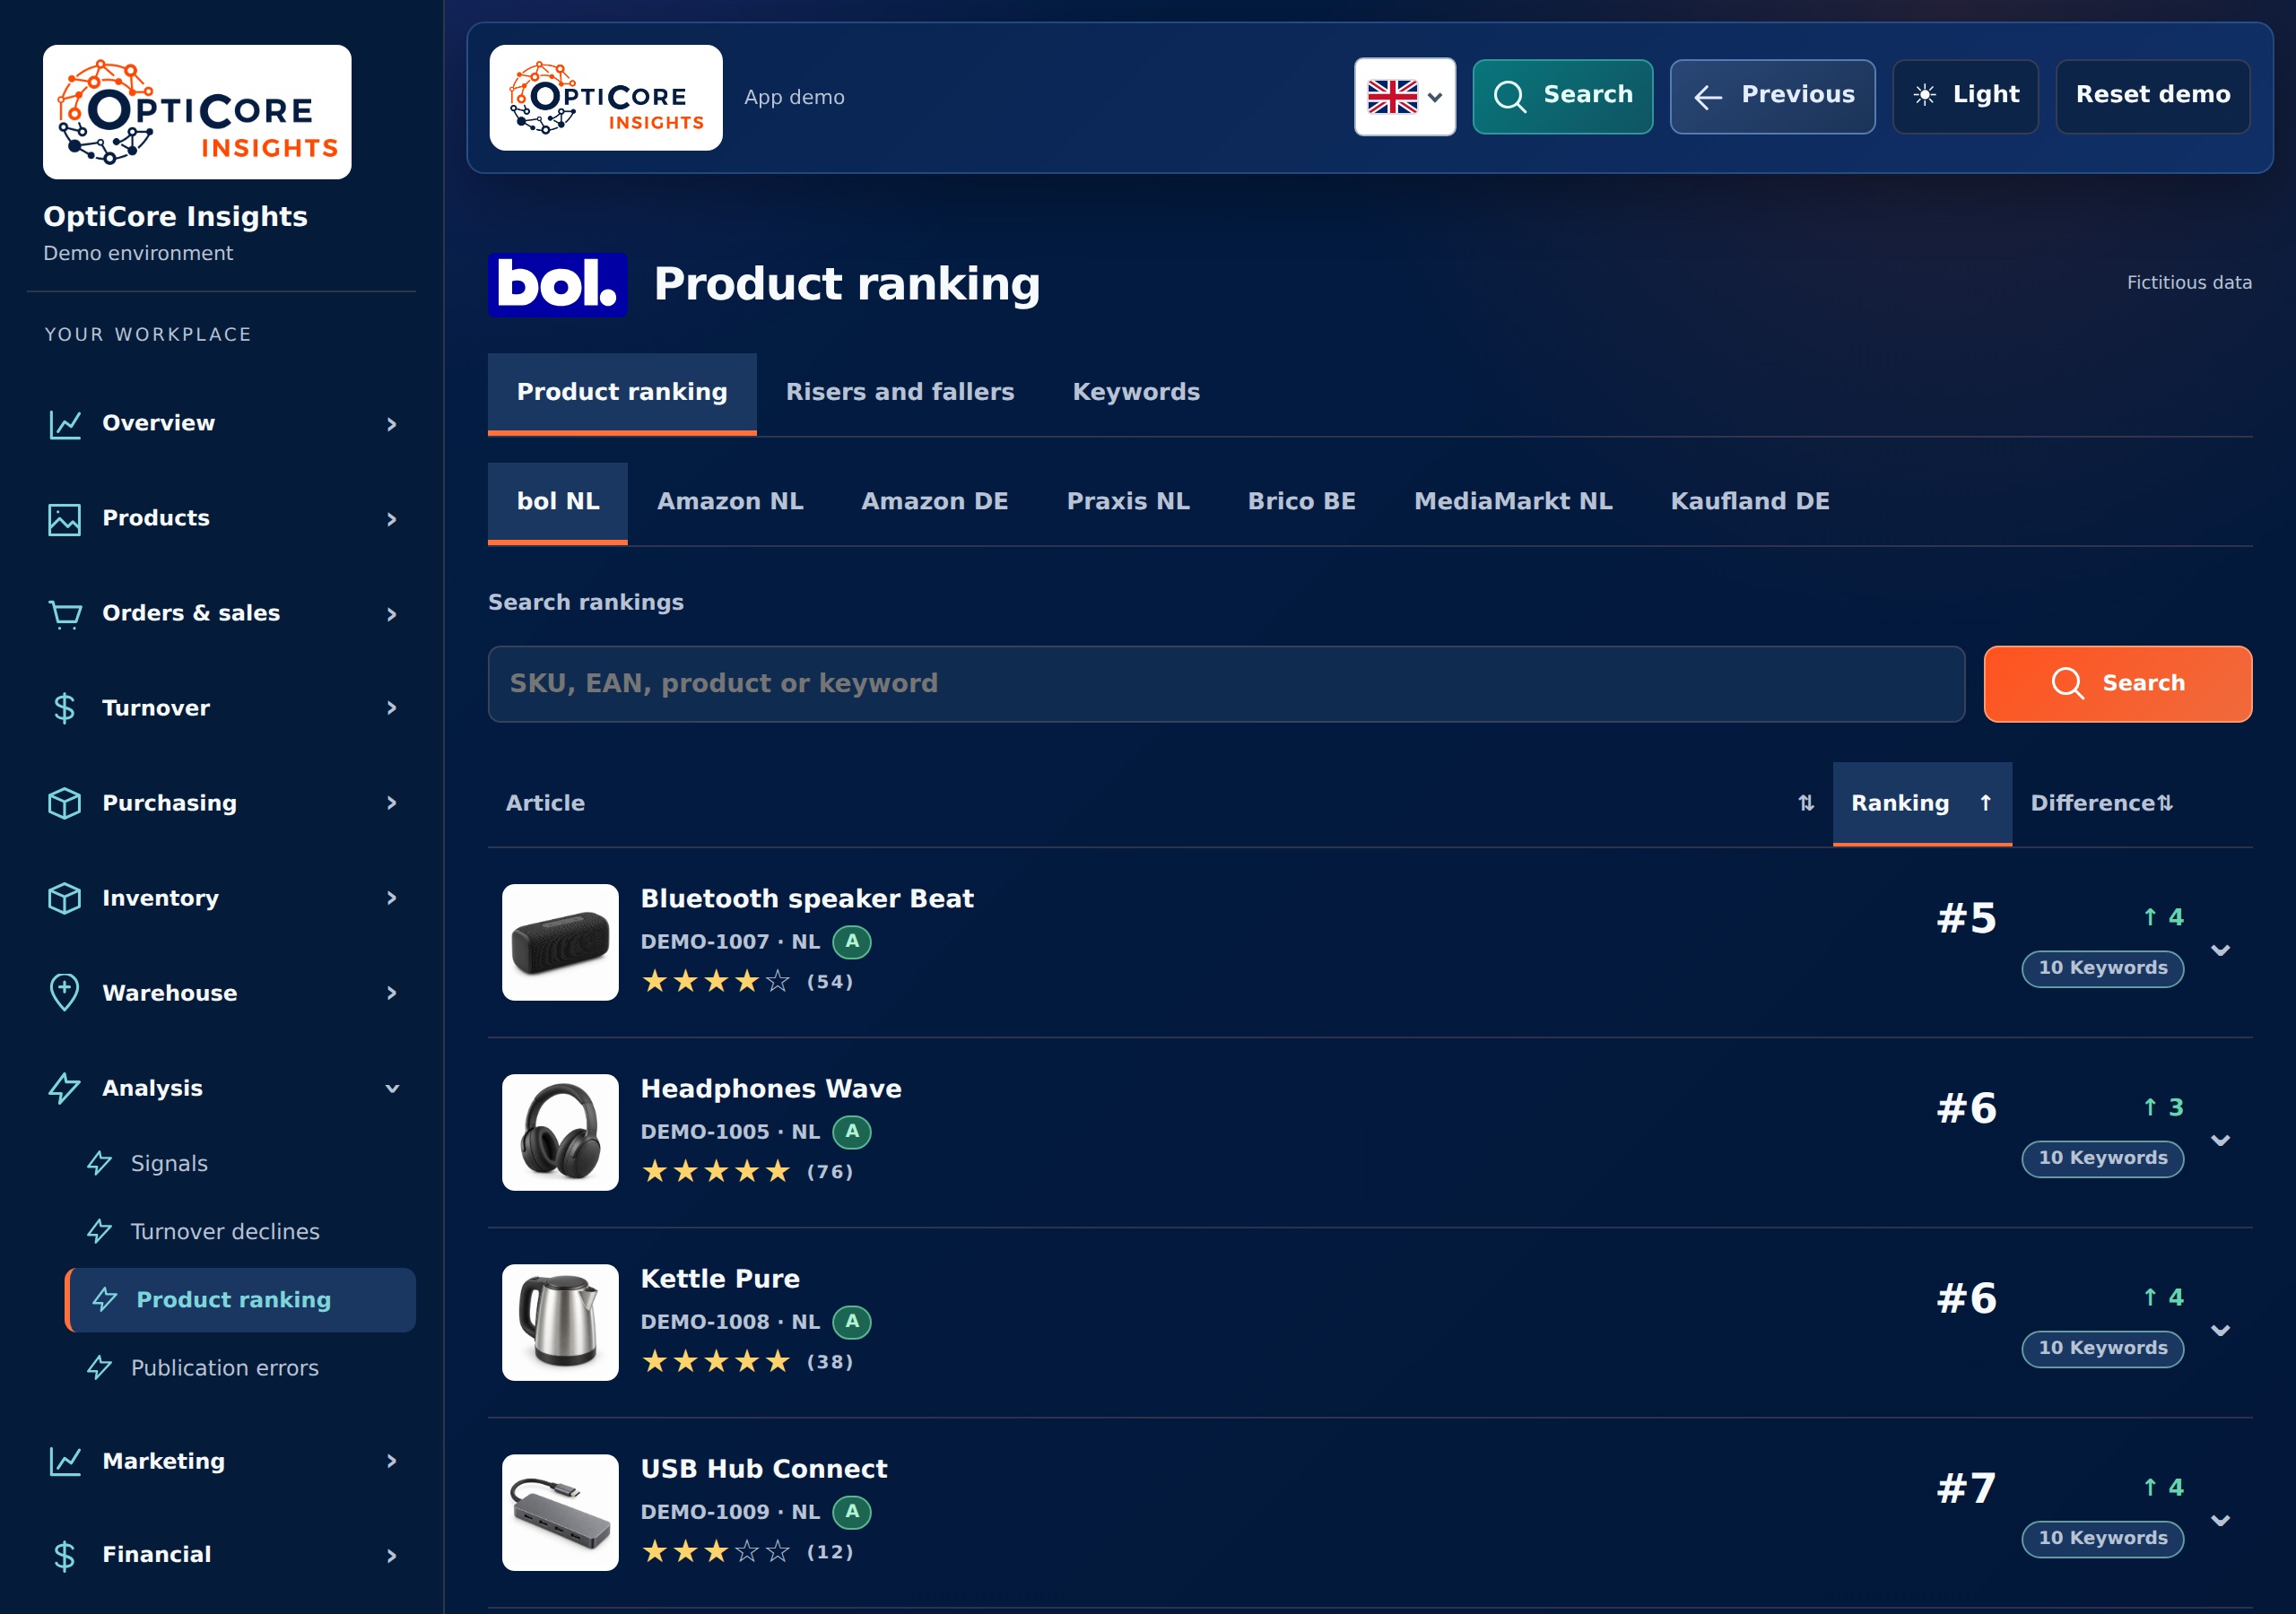
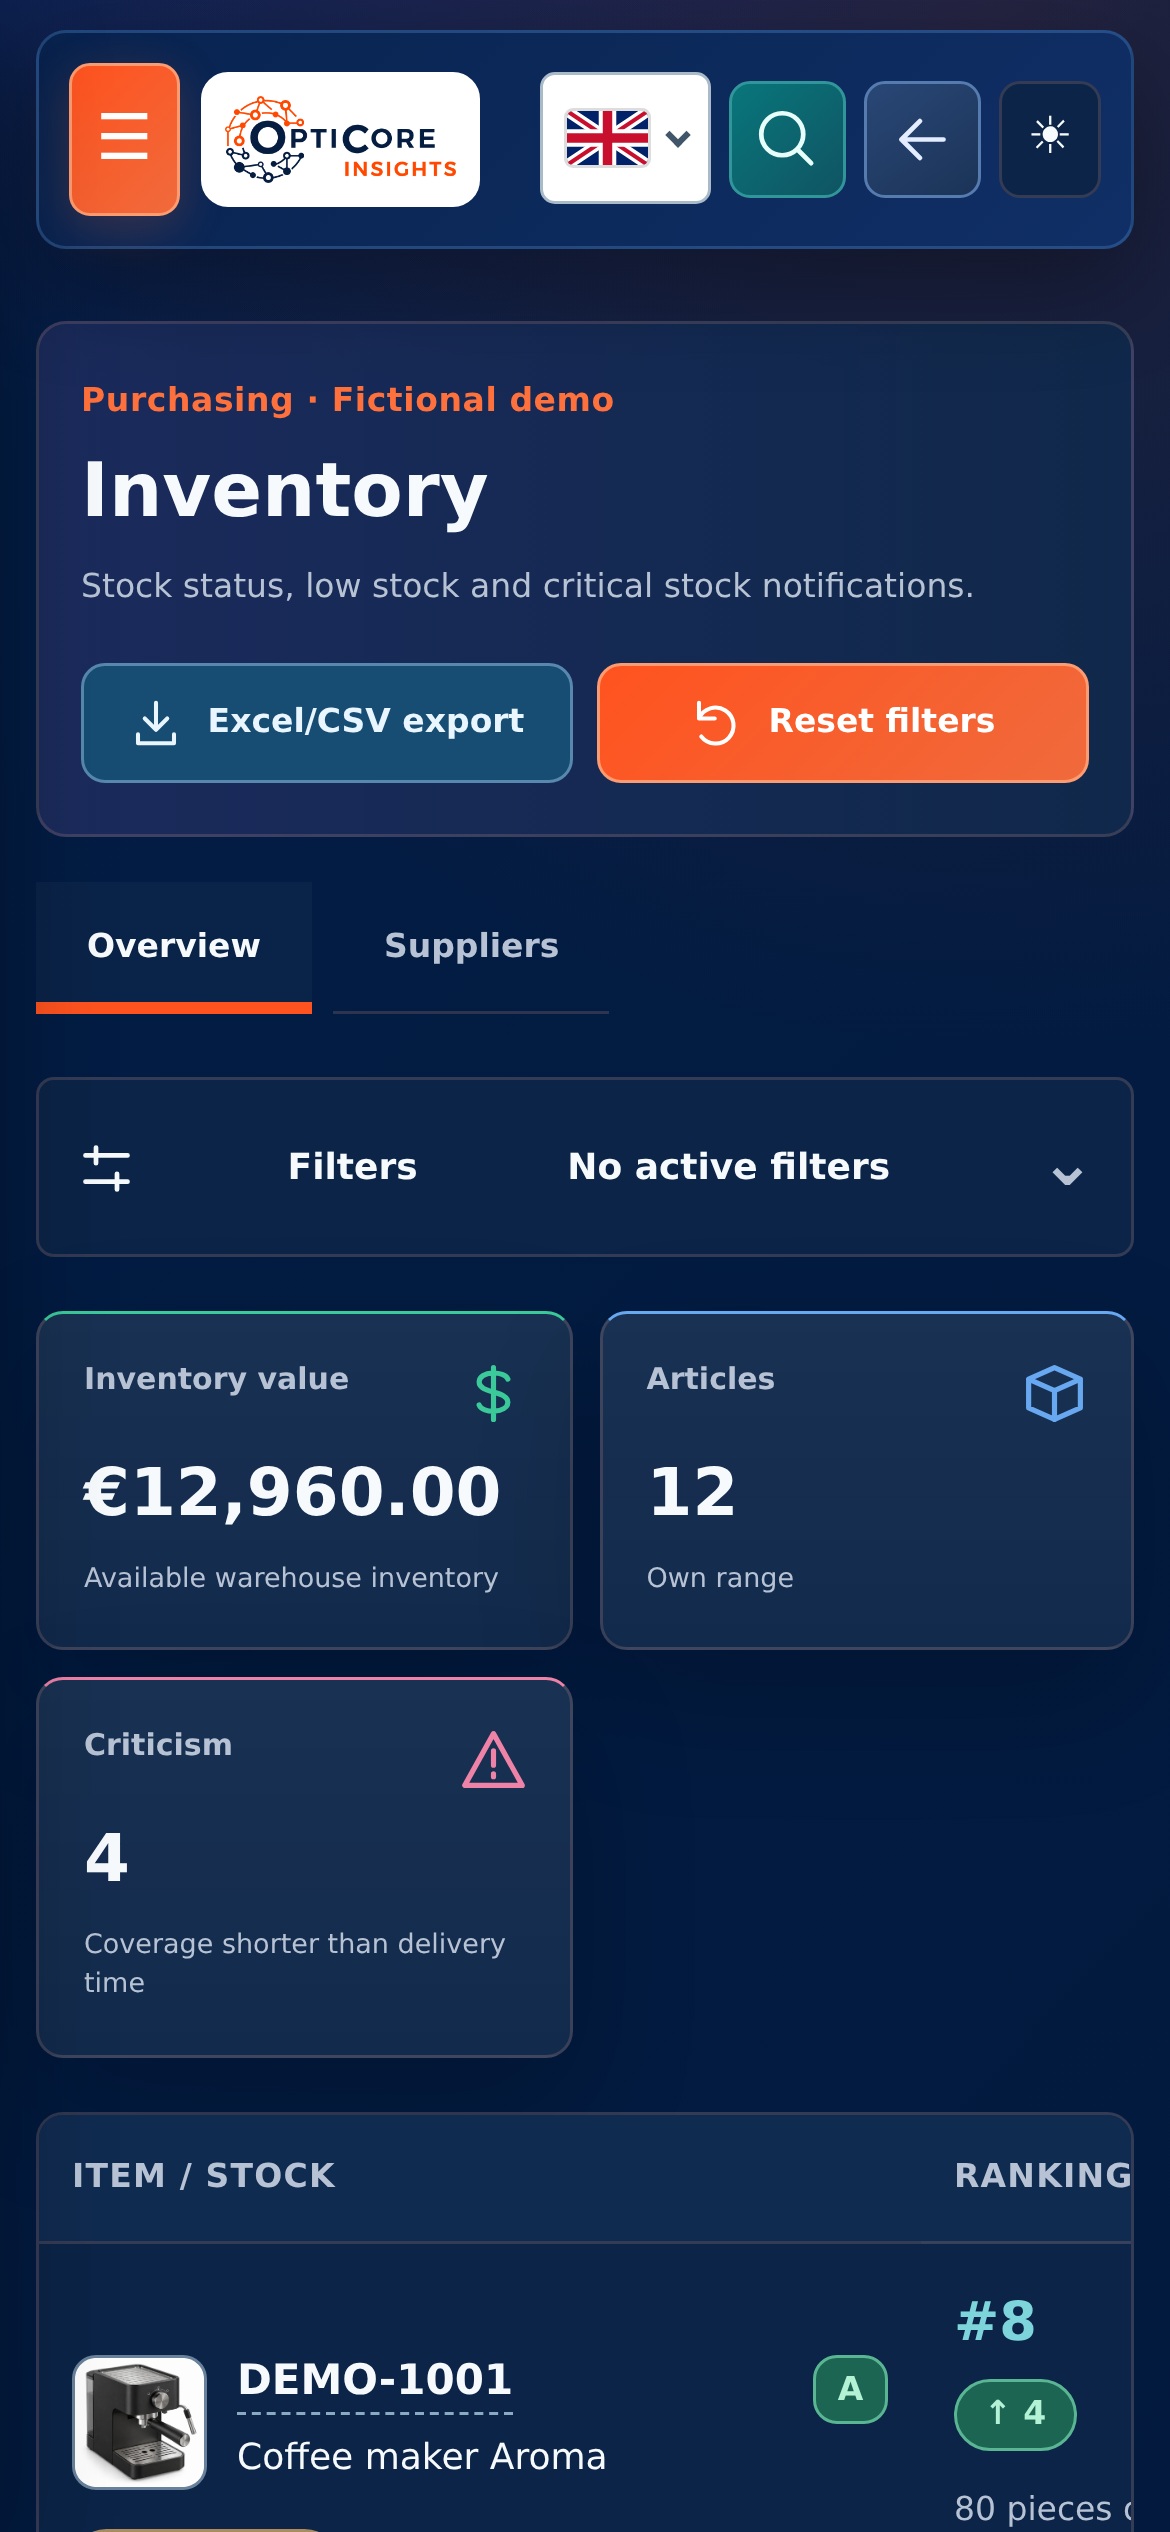
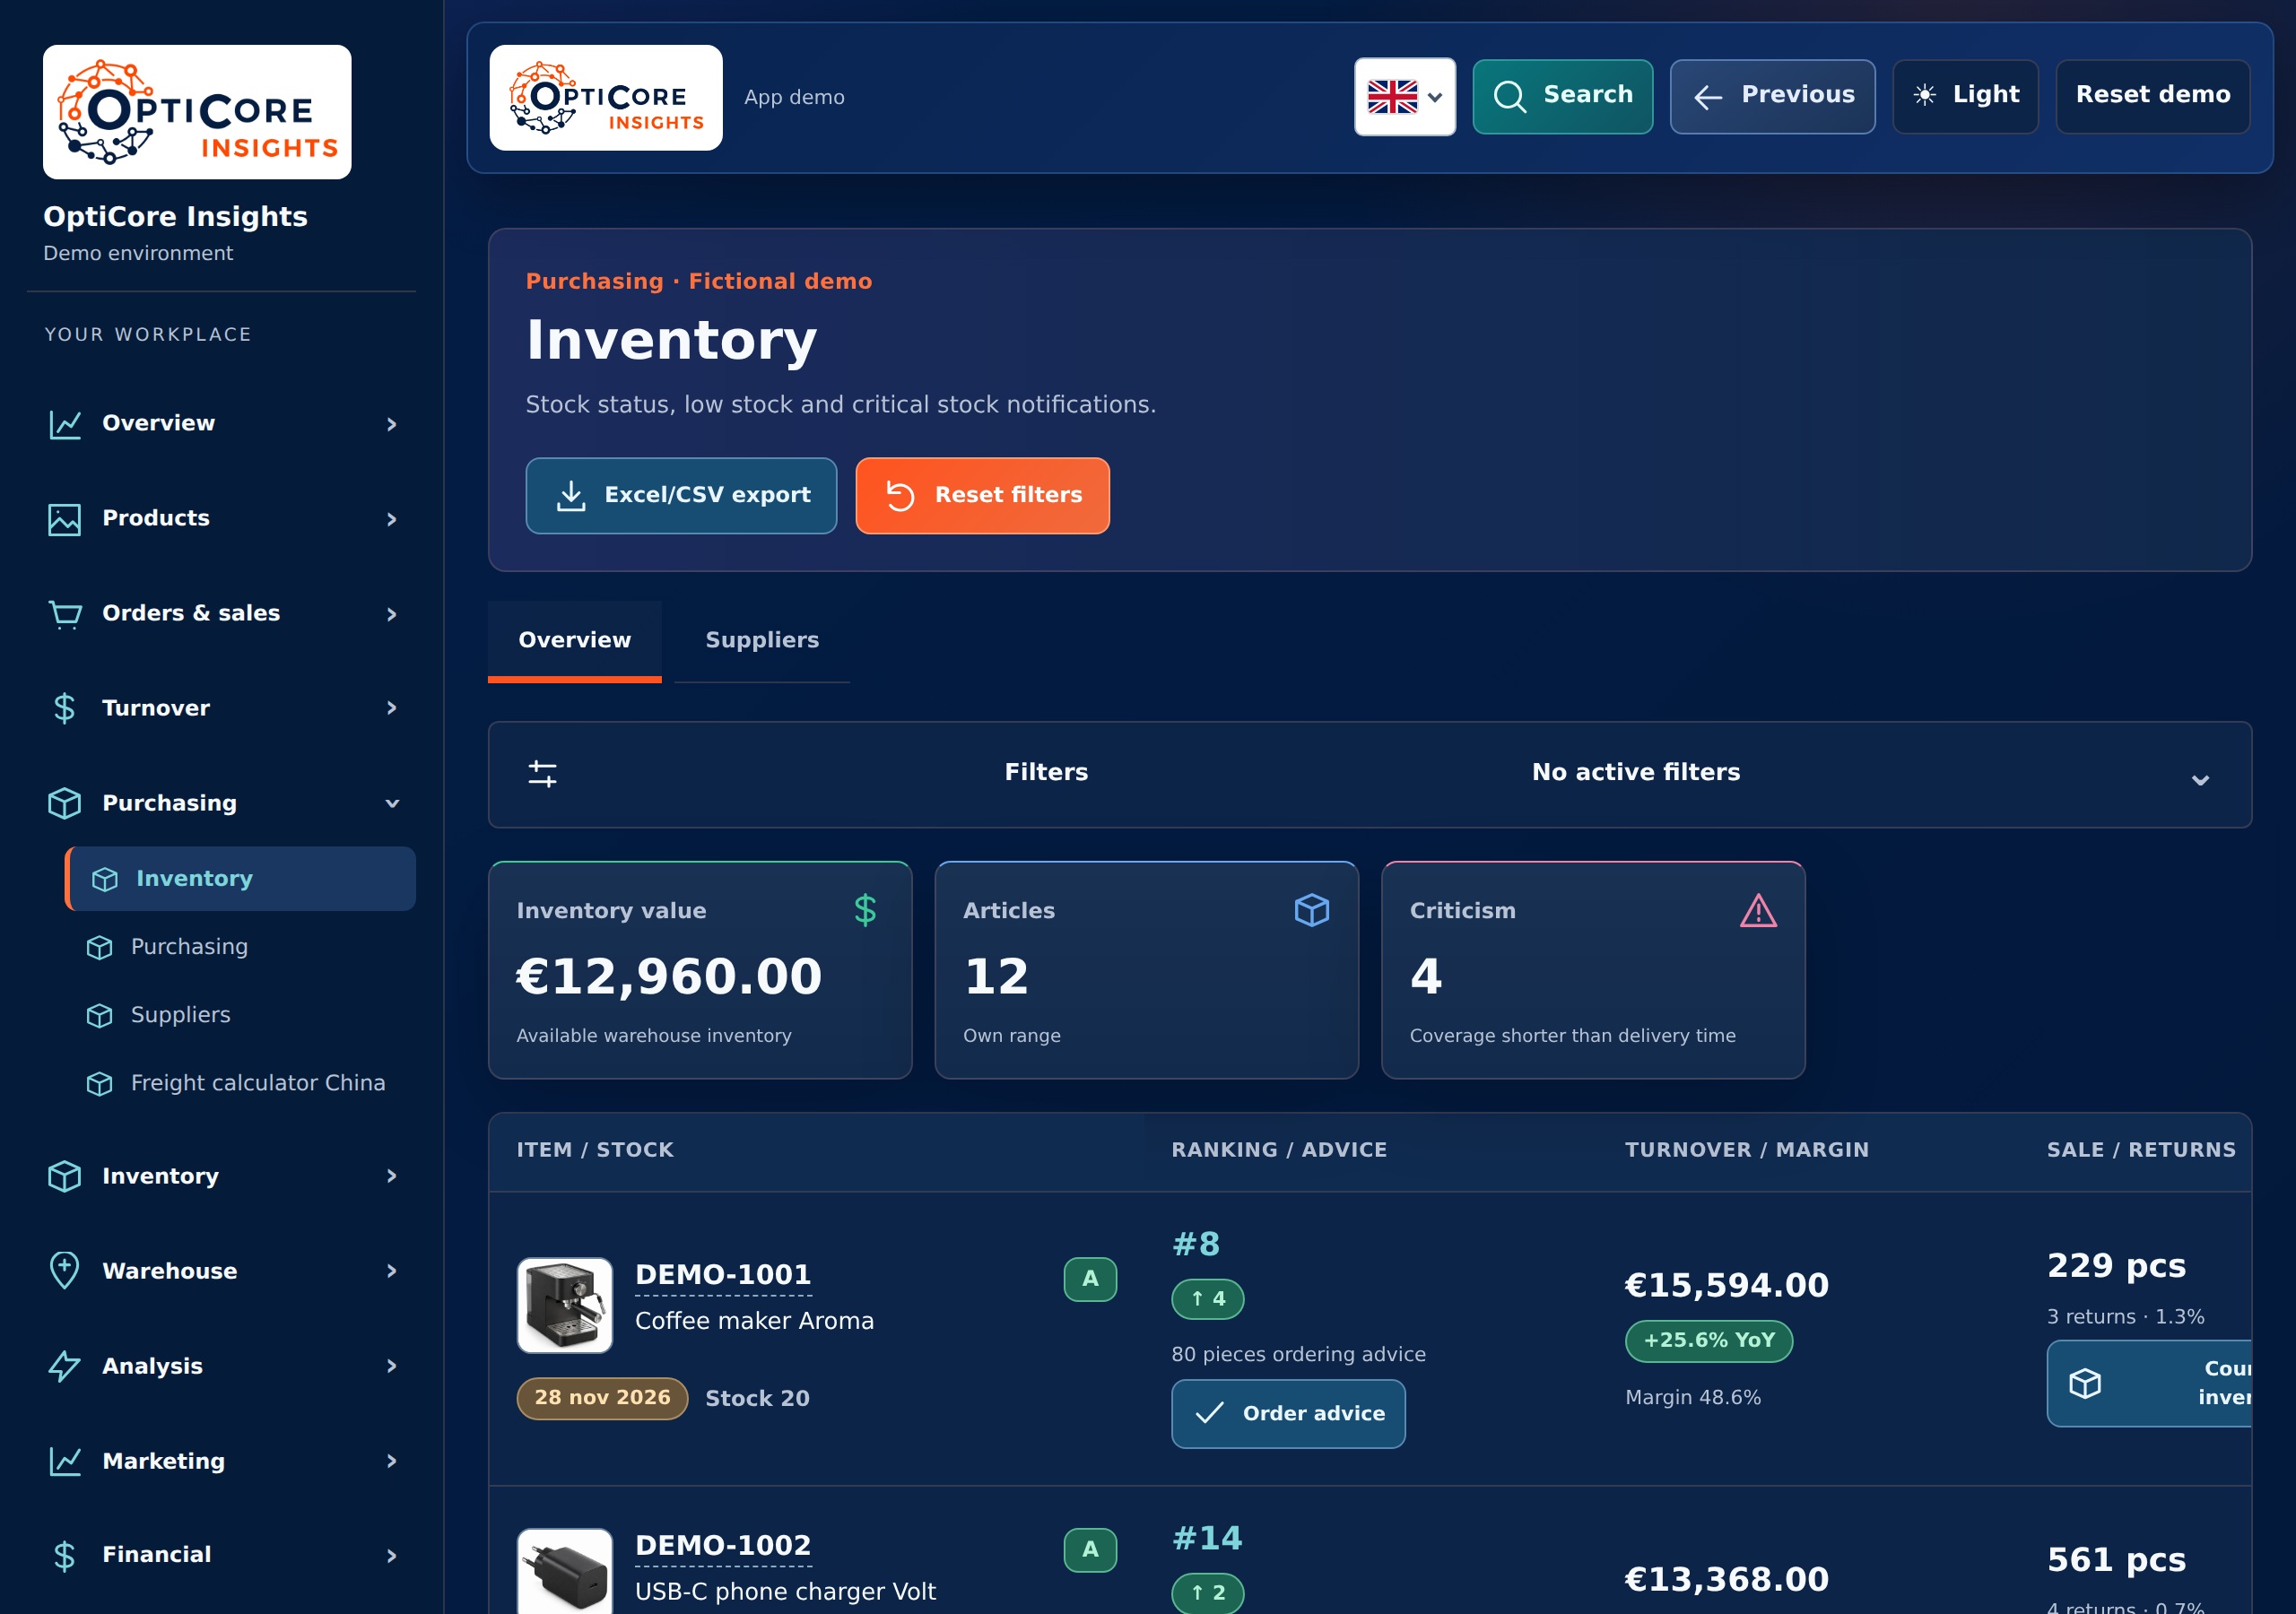
An inventory analysis shows where items are running out, lying around for a long time or tying up a lot of money. Sales, delivery time and available stock together provide context.
A forecast uses available history and assumptions to look ahead. For purchasing, this can help determine an ordering time or quantity.
Reporting and automation require actionable source data. Checks reveal missing, duplicate or anomalous data.
Tell us what you want to have made or what work currently takes a lot of time.
Discuss your questionOur approach
We make agreements easy to understand and keep you informed about progress, decisions and next steps.

We bring relevant figures together and explain what they mean, helping you decide where action is needed.

We look at which recurring steps could work smarter, with attention to checks, exceptions and the people using them.

We start with a clearly defined step. Then we expand with purpose, based on what your business and workflow need.