

Clear communication
We make agreements easy to understand and keep you informed about progress, decisions and next steps.
Explanation and possibilities
A KPI dashboard shows how a company or process is doing. It works best if each number helps answer a specific question.
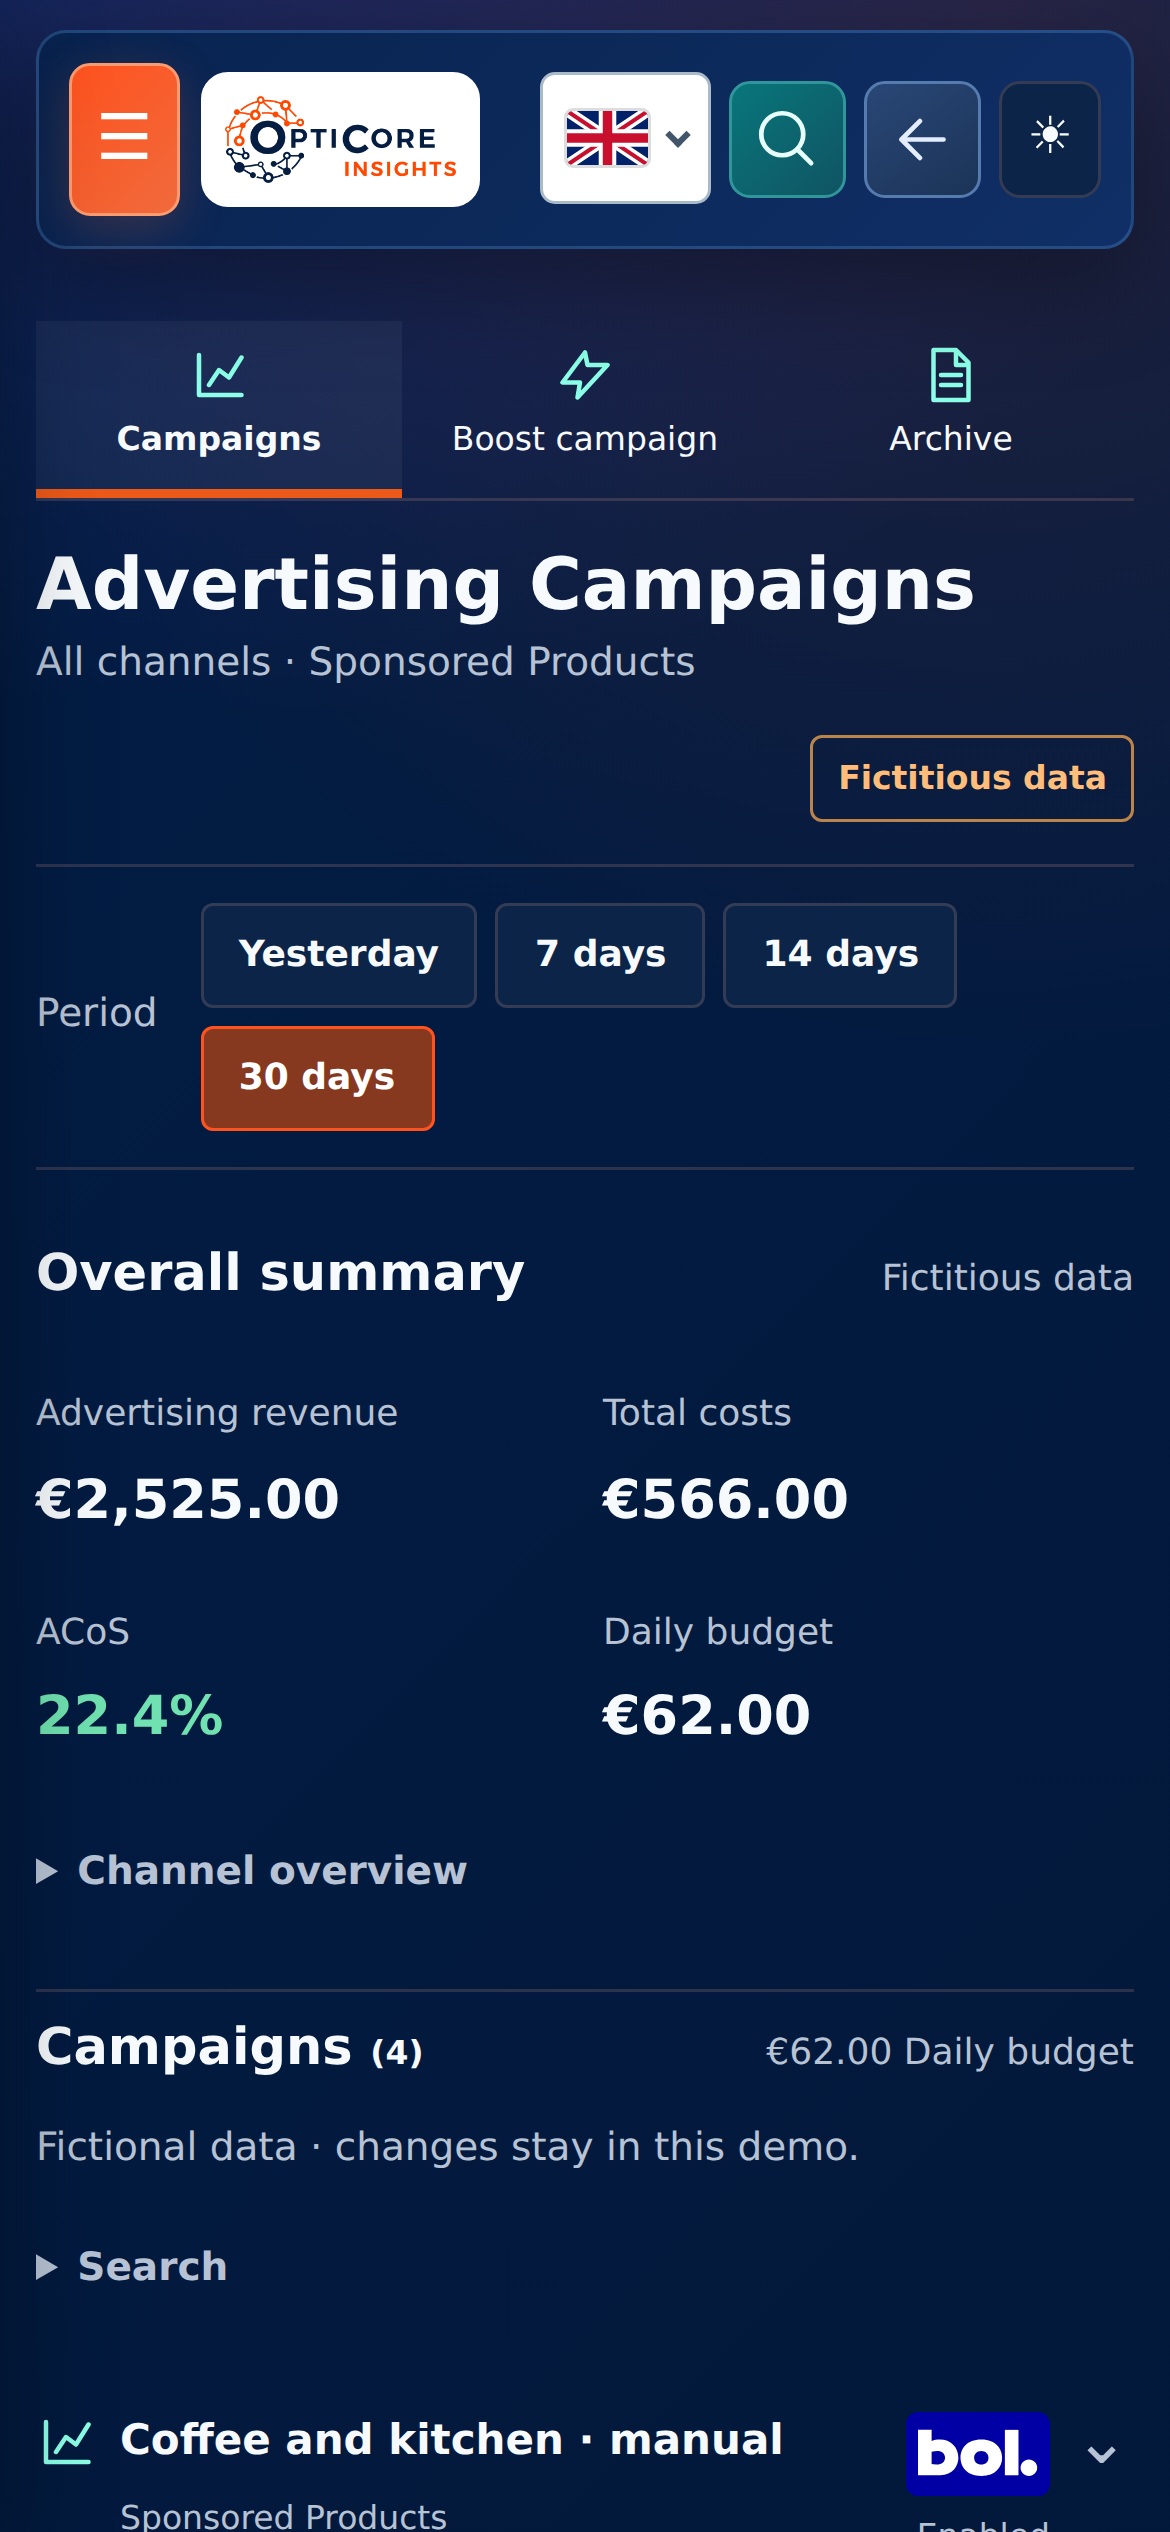
Start with the decisions you make. For inventory, this may be the expected inventory life; for marketing the ratio between costs and revenues. Give each figure a definition, period and recognizable equation.
In pictures · Smartlife Domotica
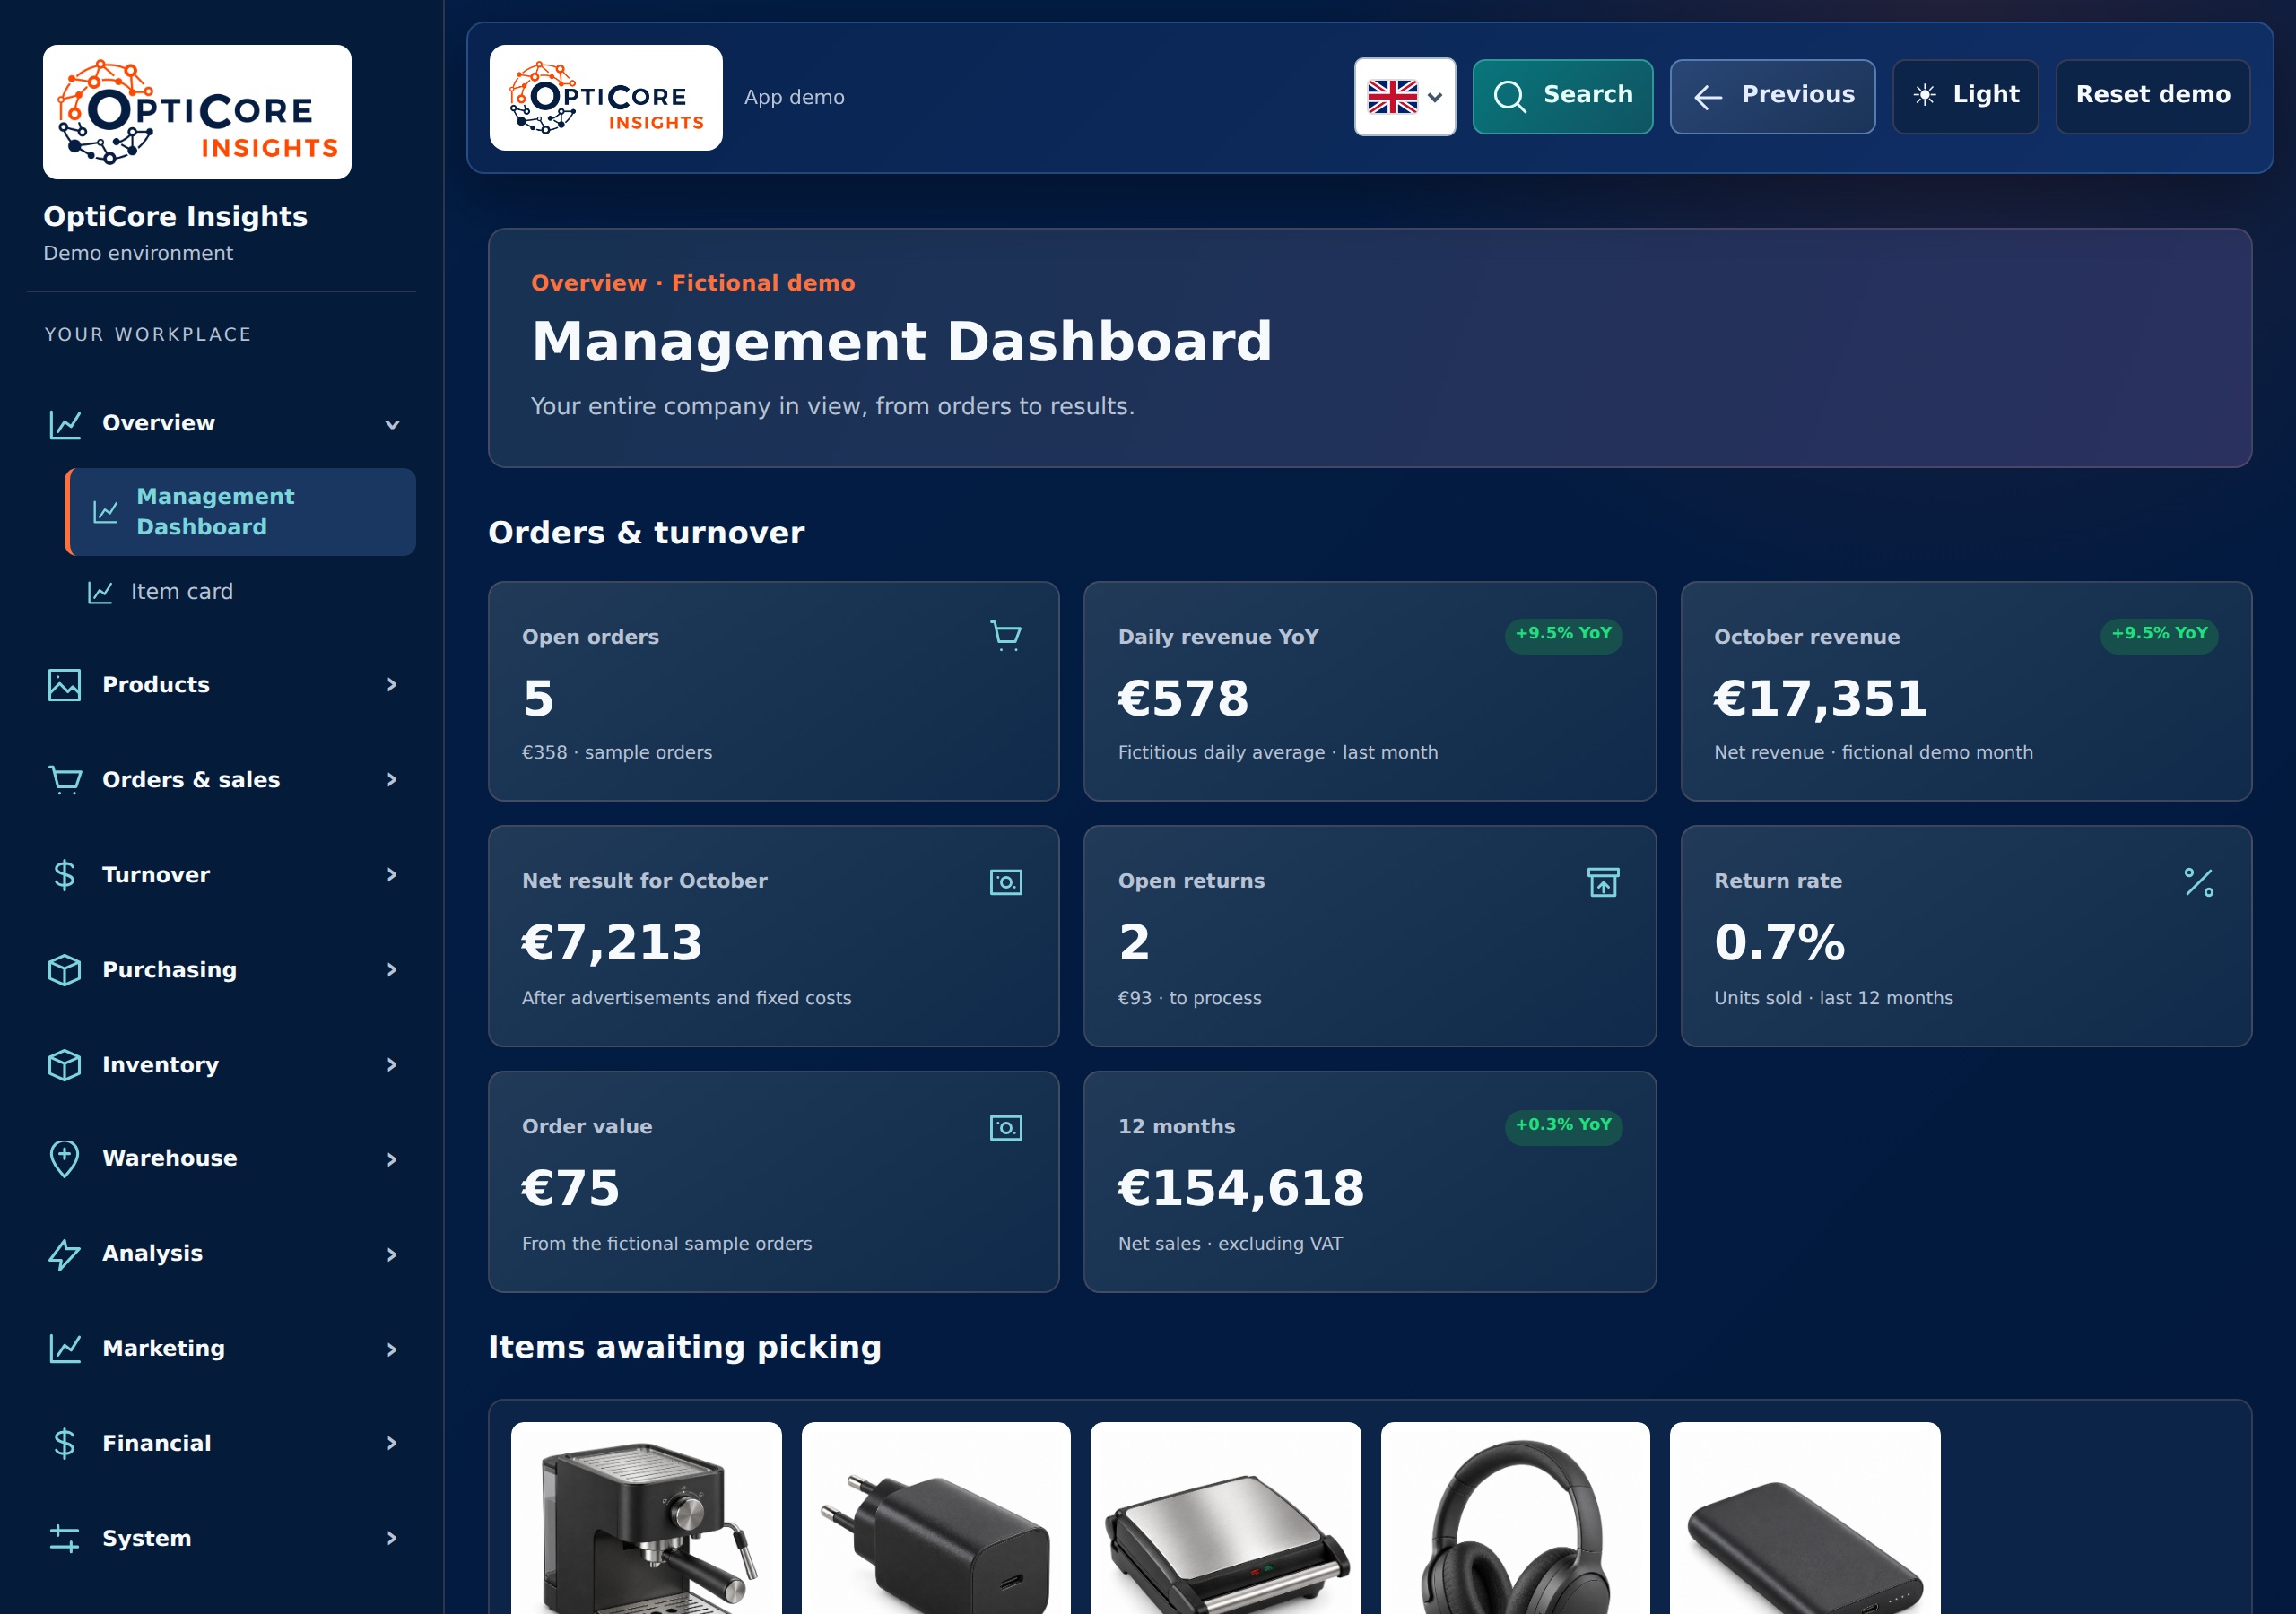
The management overview brings together turnover, orders, returns and marketing. A comparison with last year provides context for a notable increase or decrease.
From the overview you can continue to the topic that requires attention. For example, researching an item, viewing stock or assessing a marketing proposal.
View the project and approach →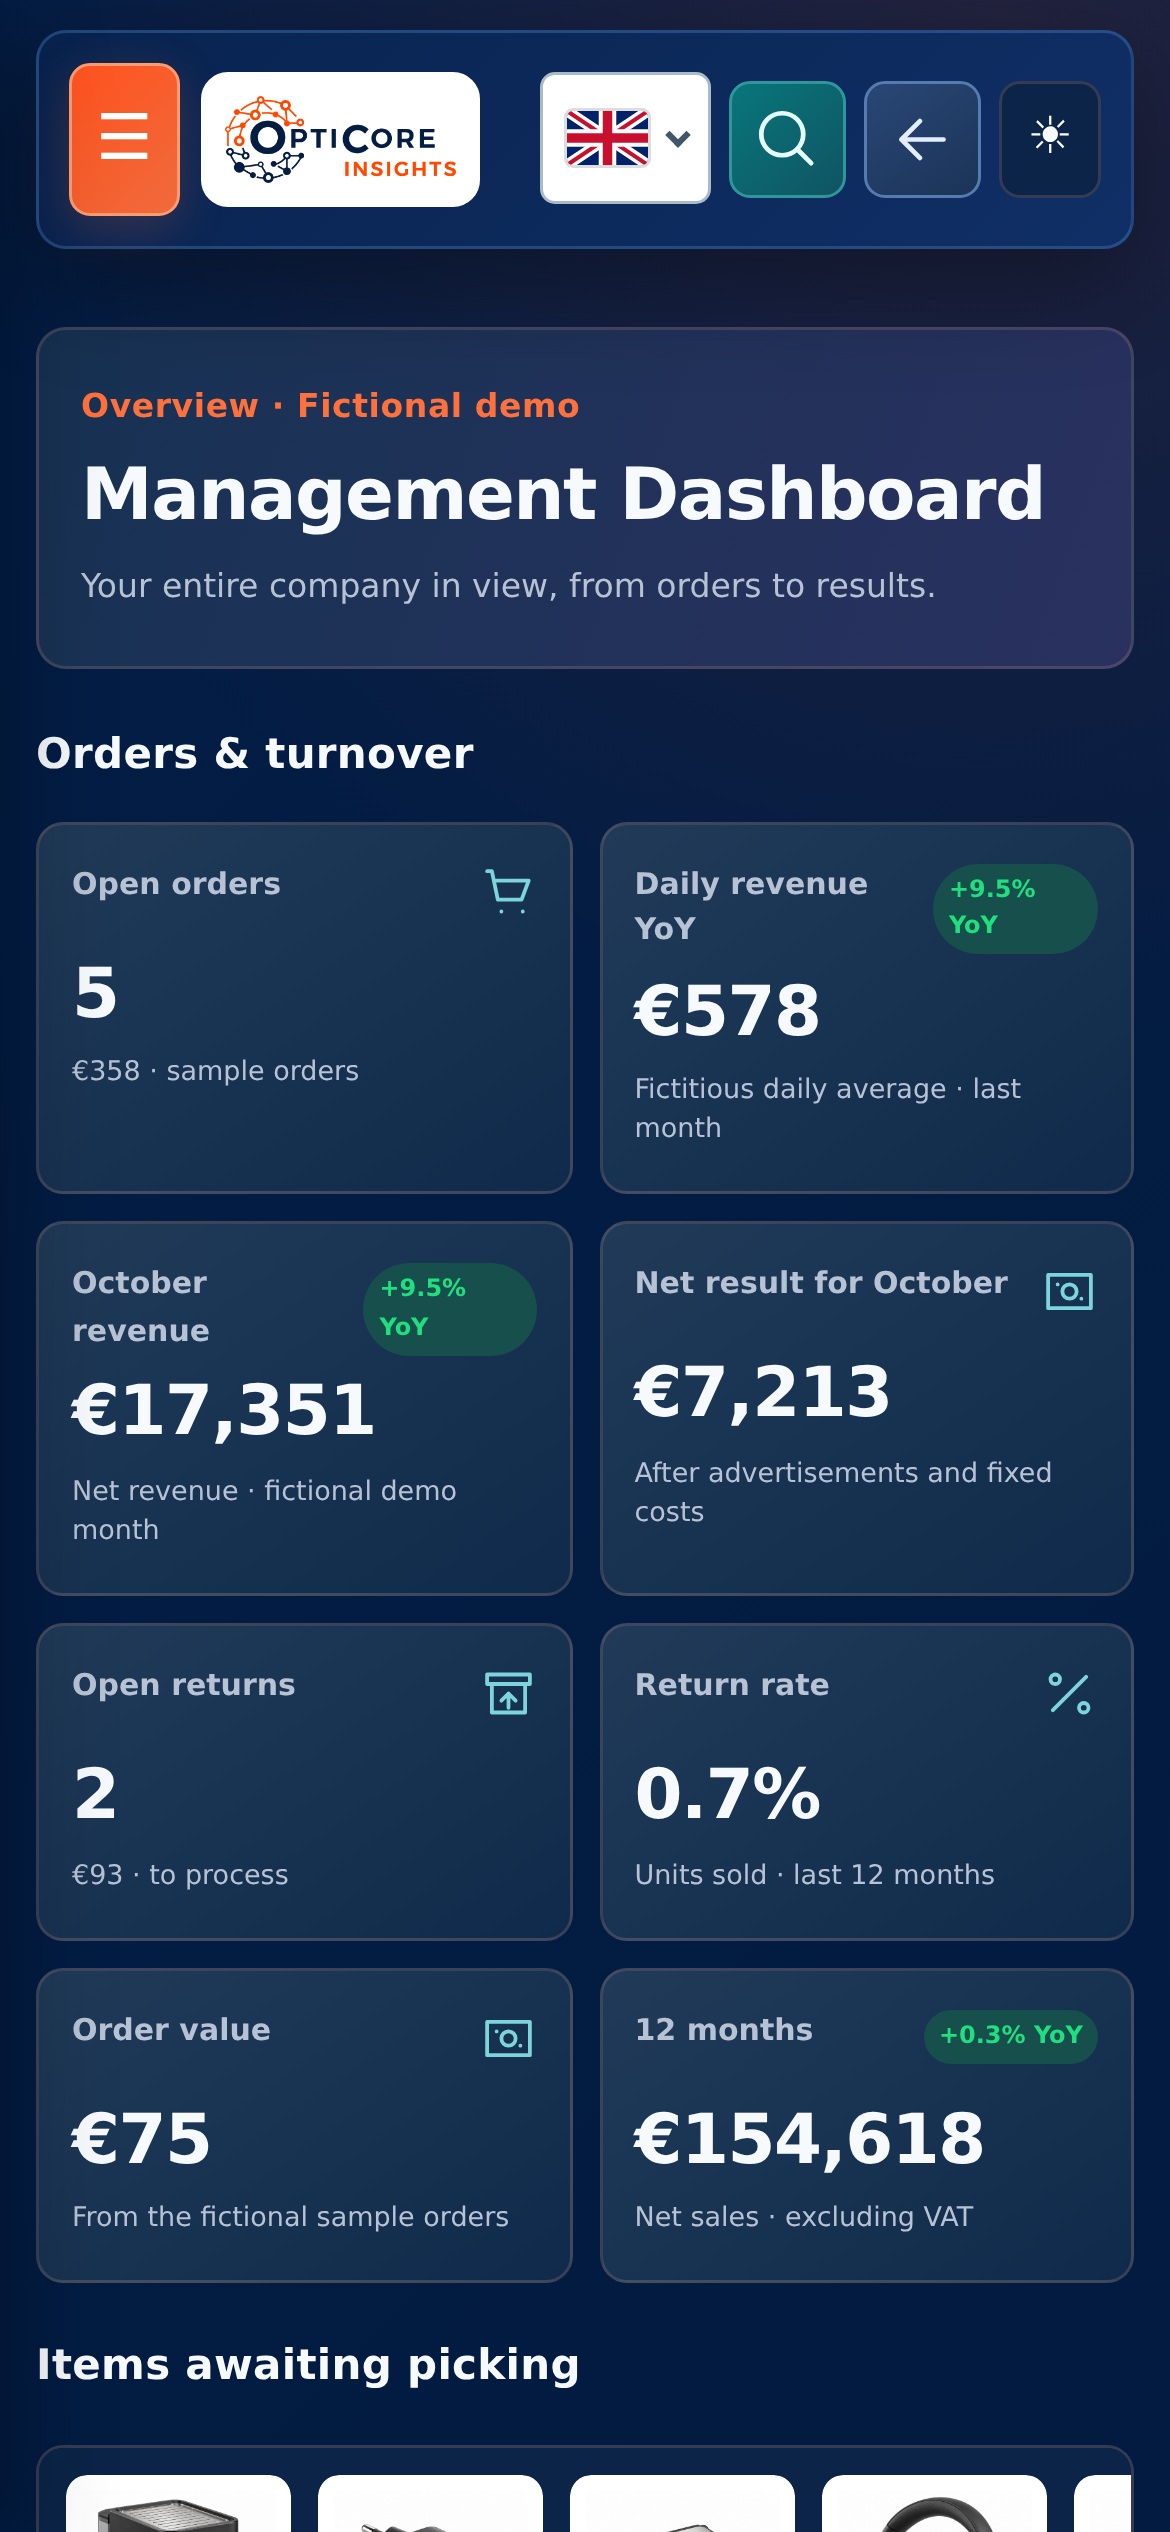
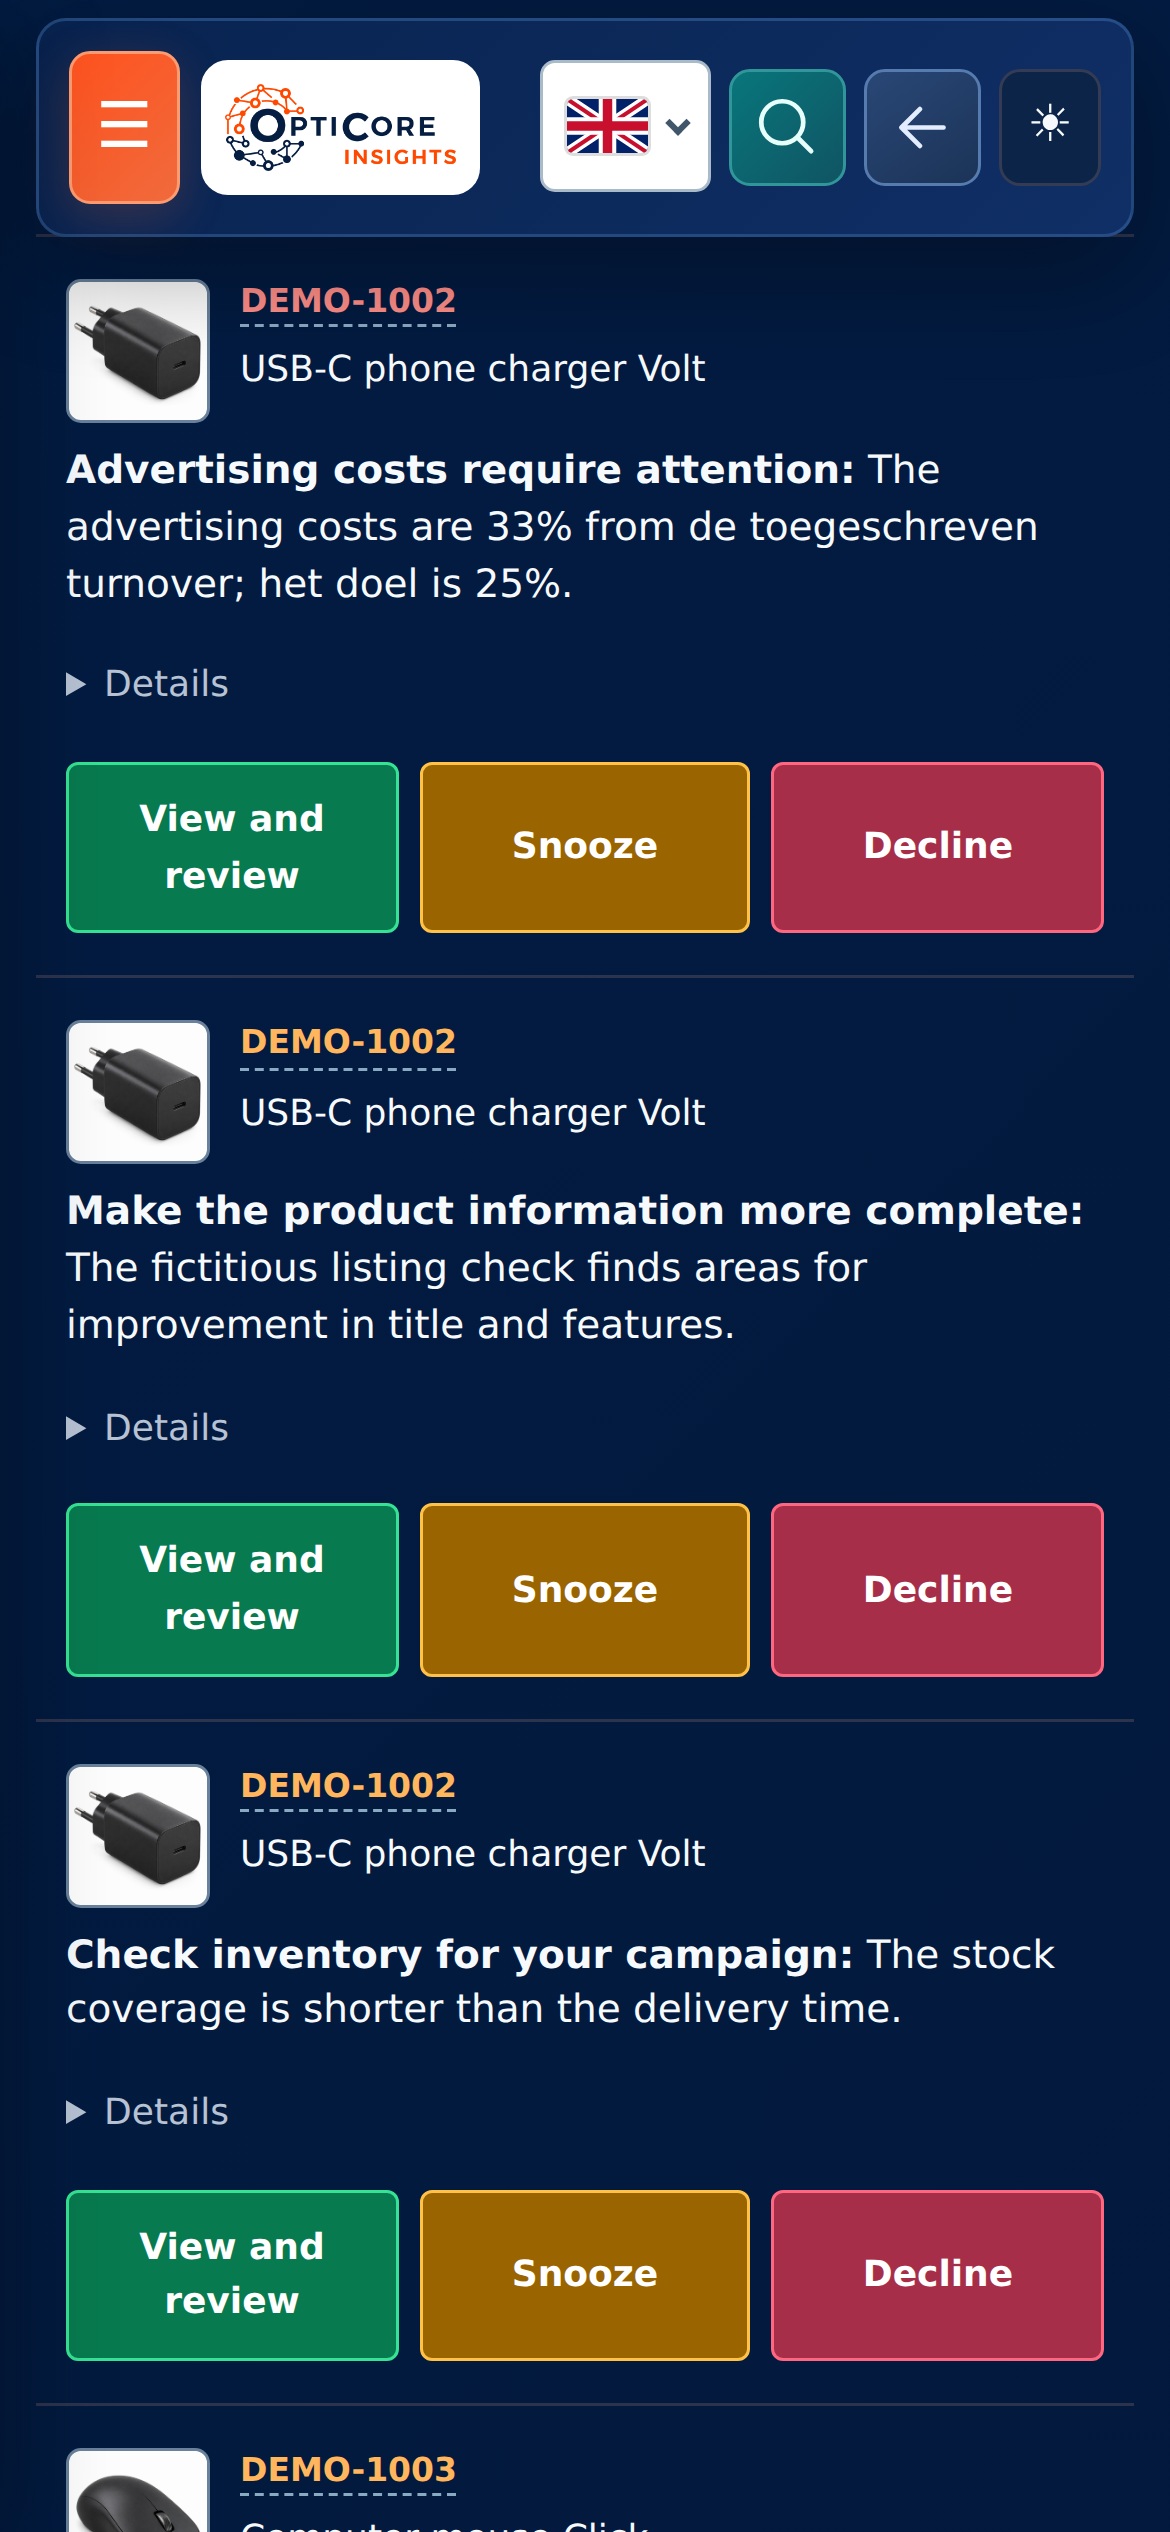
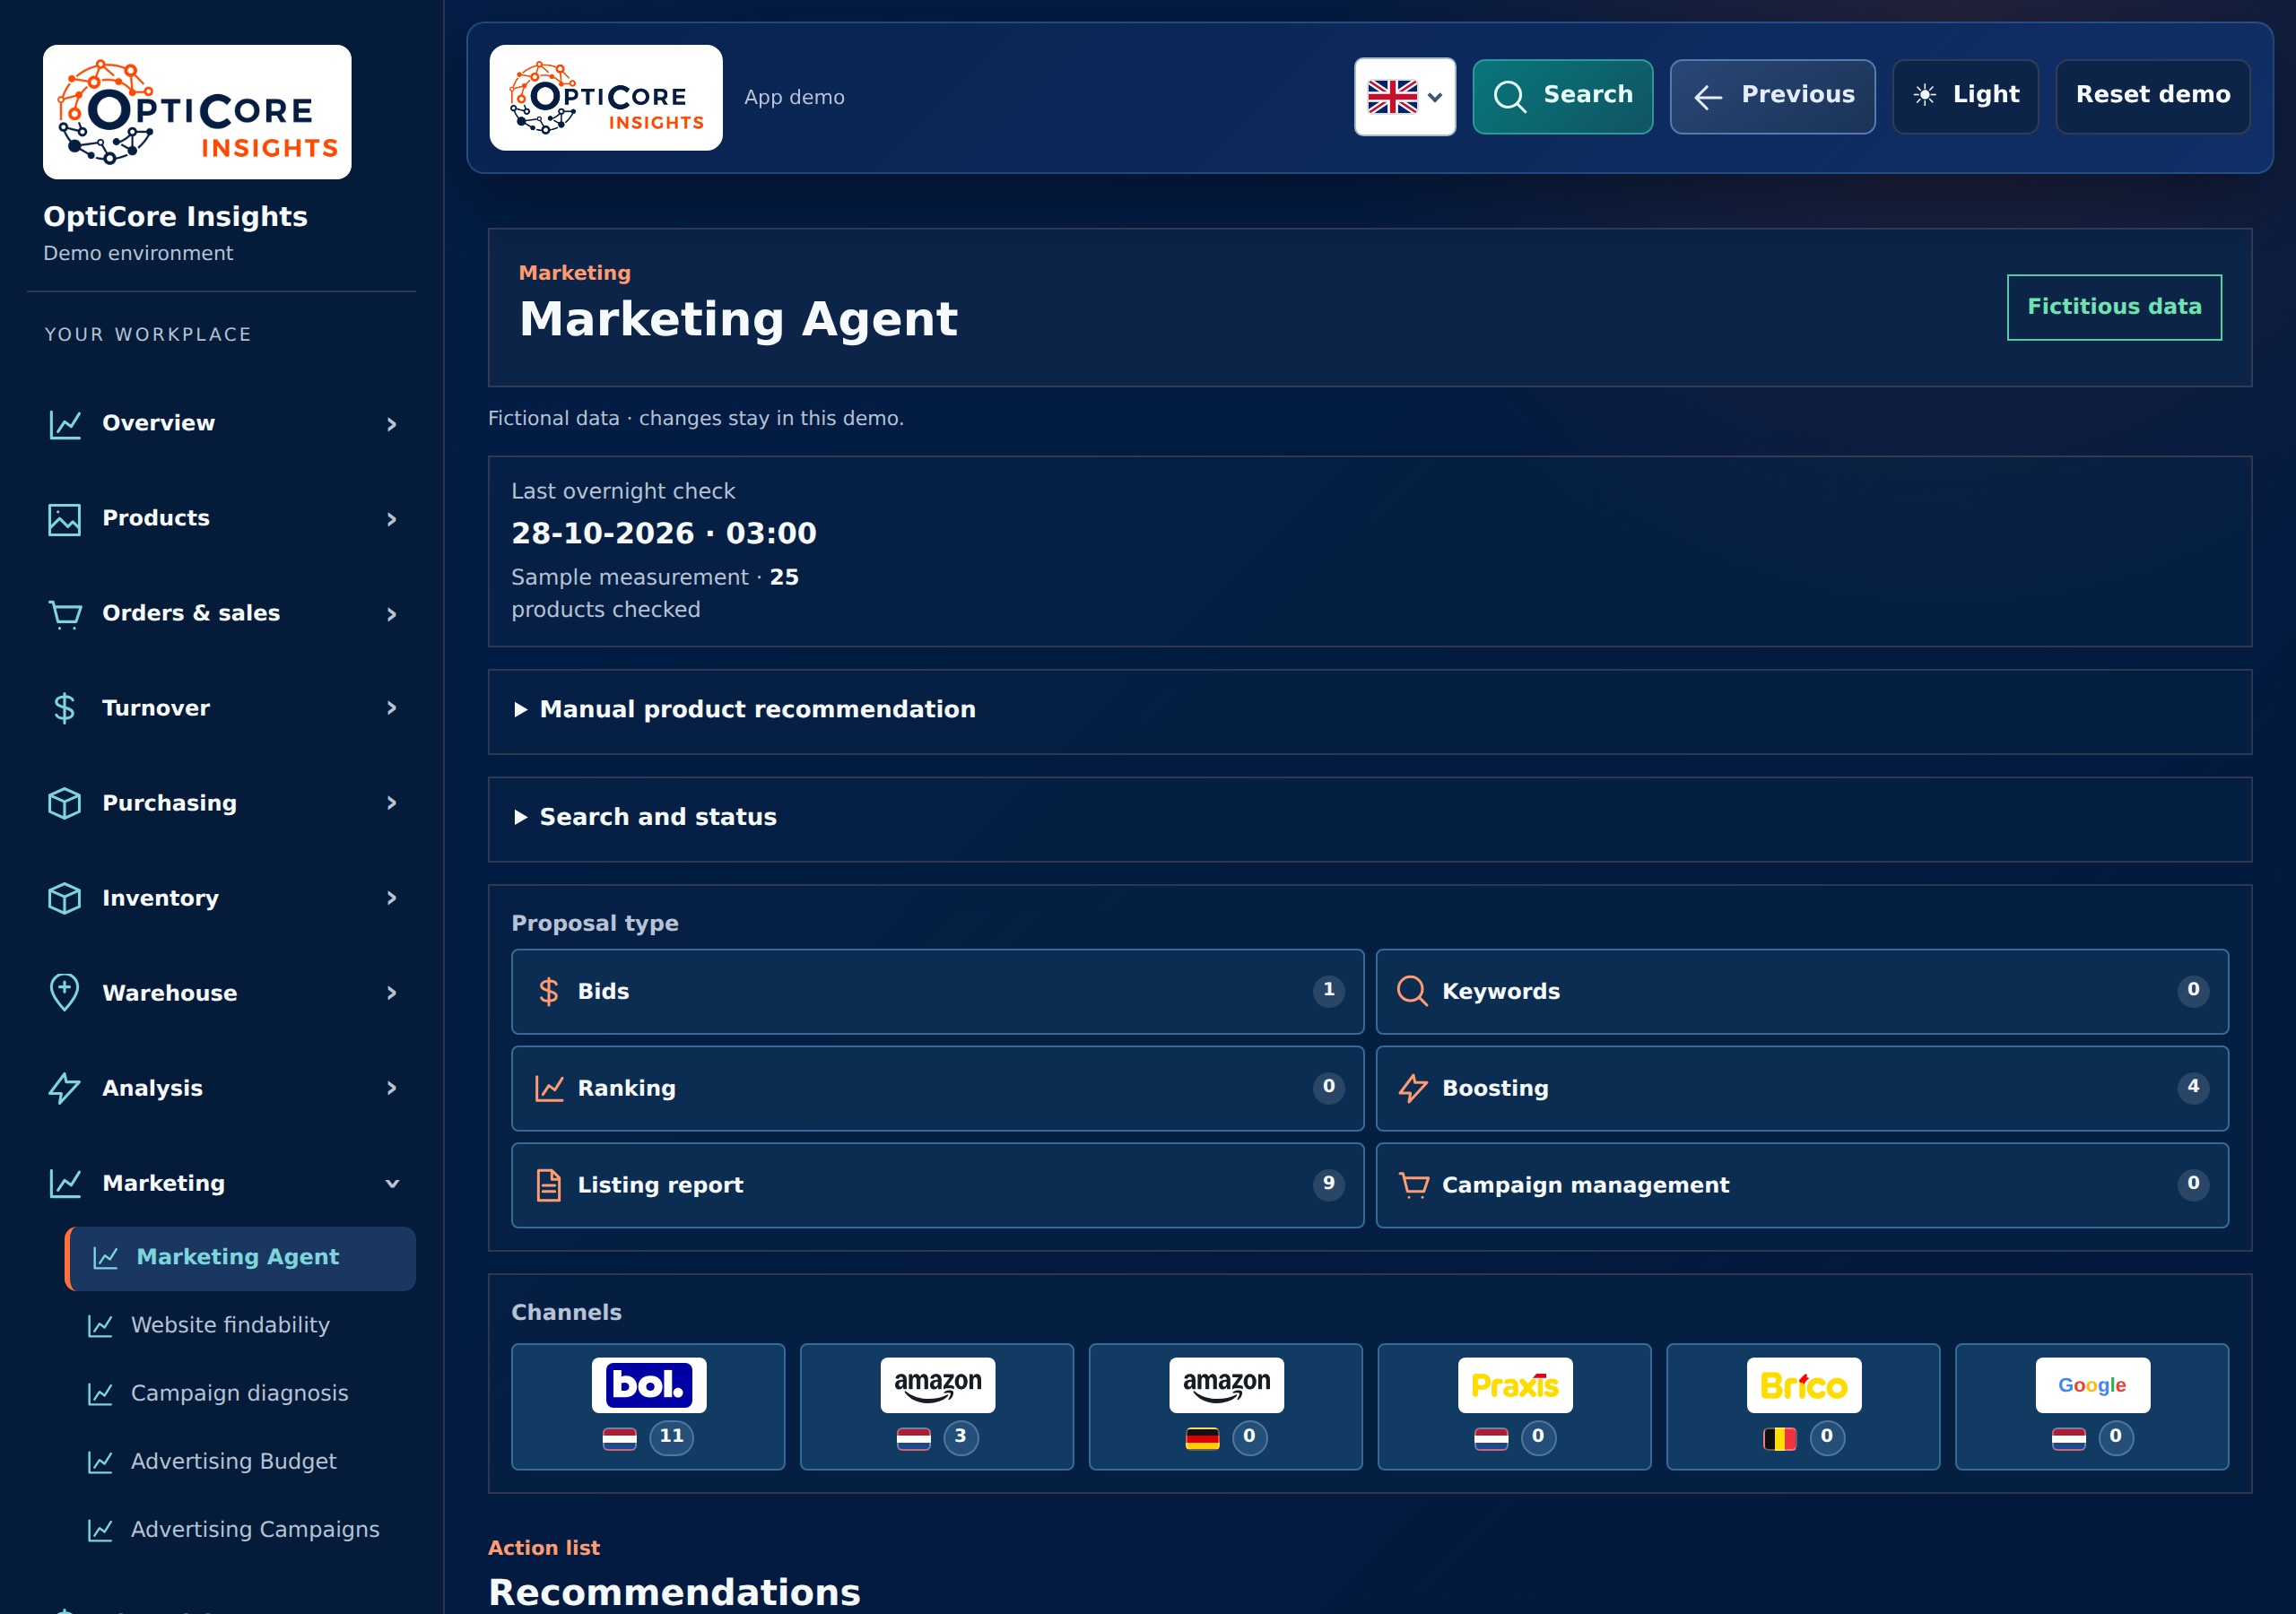
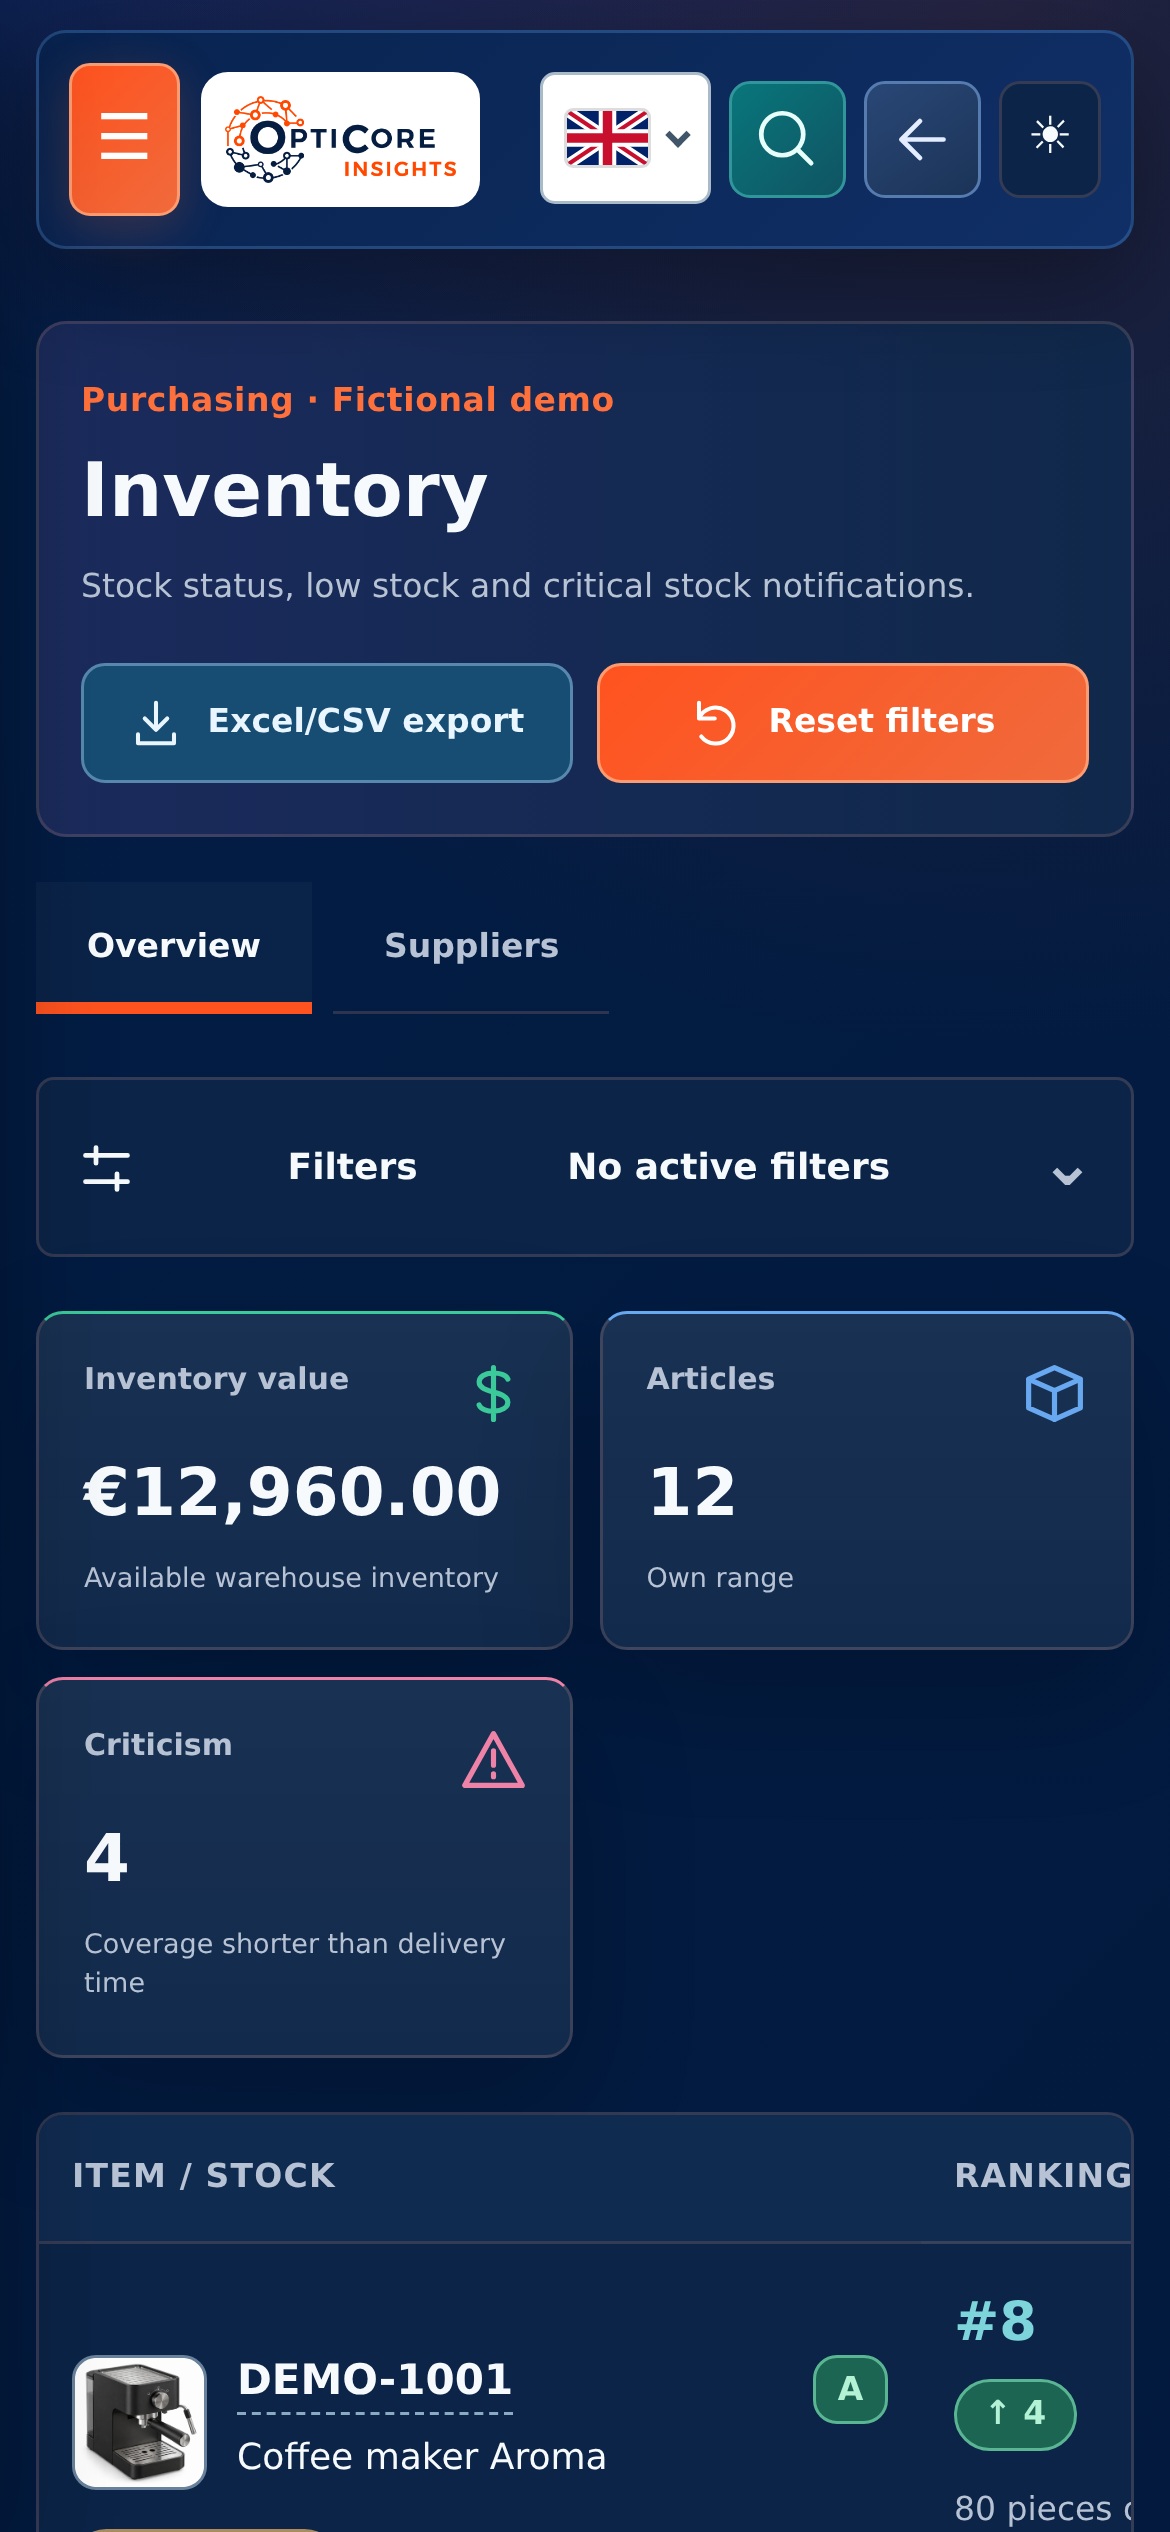
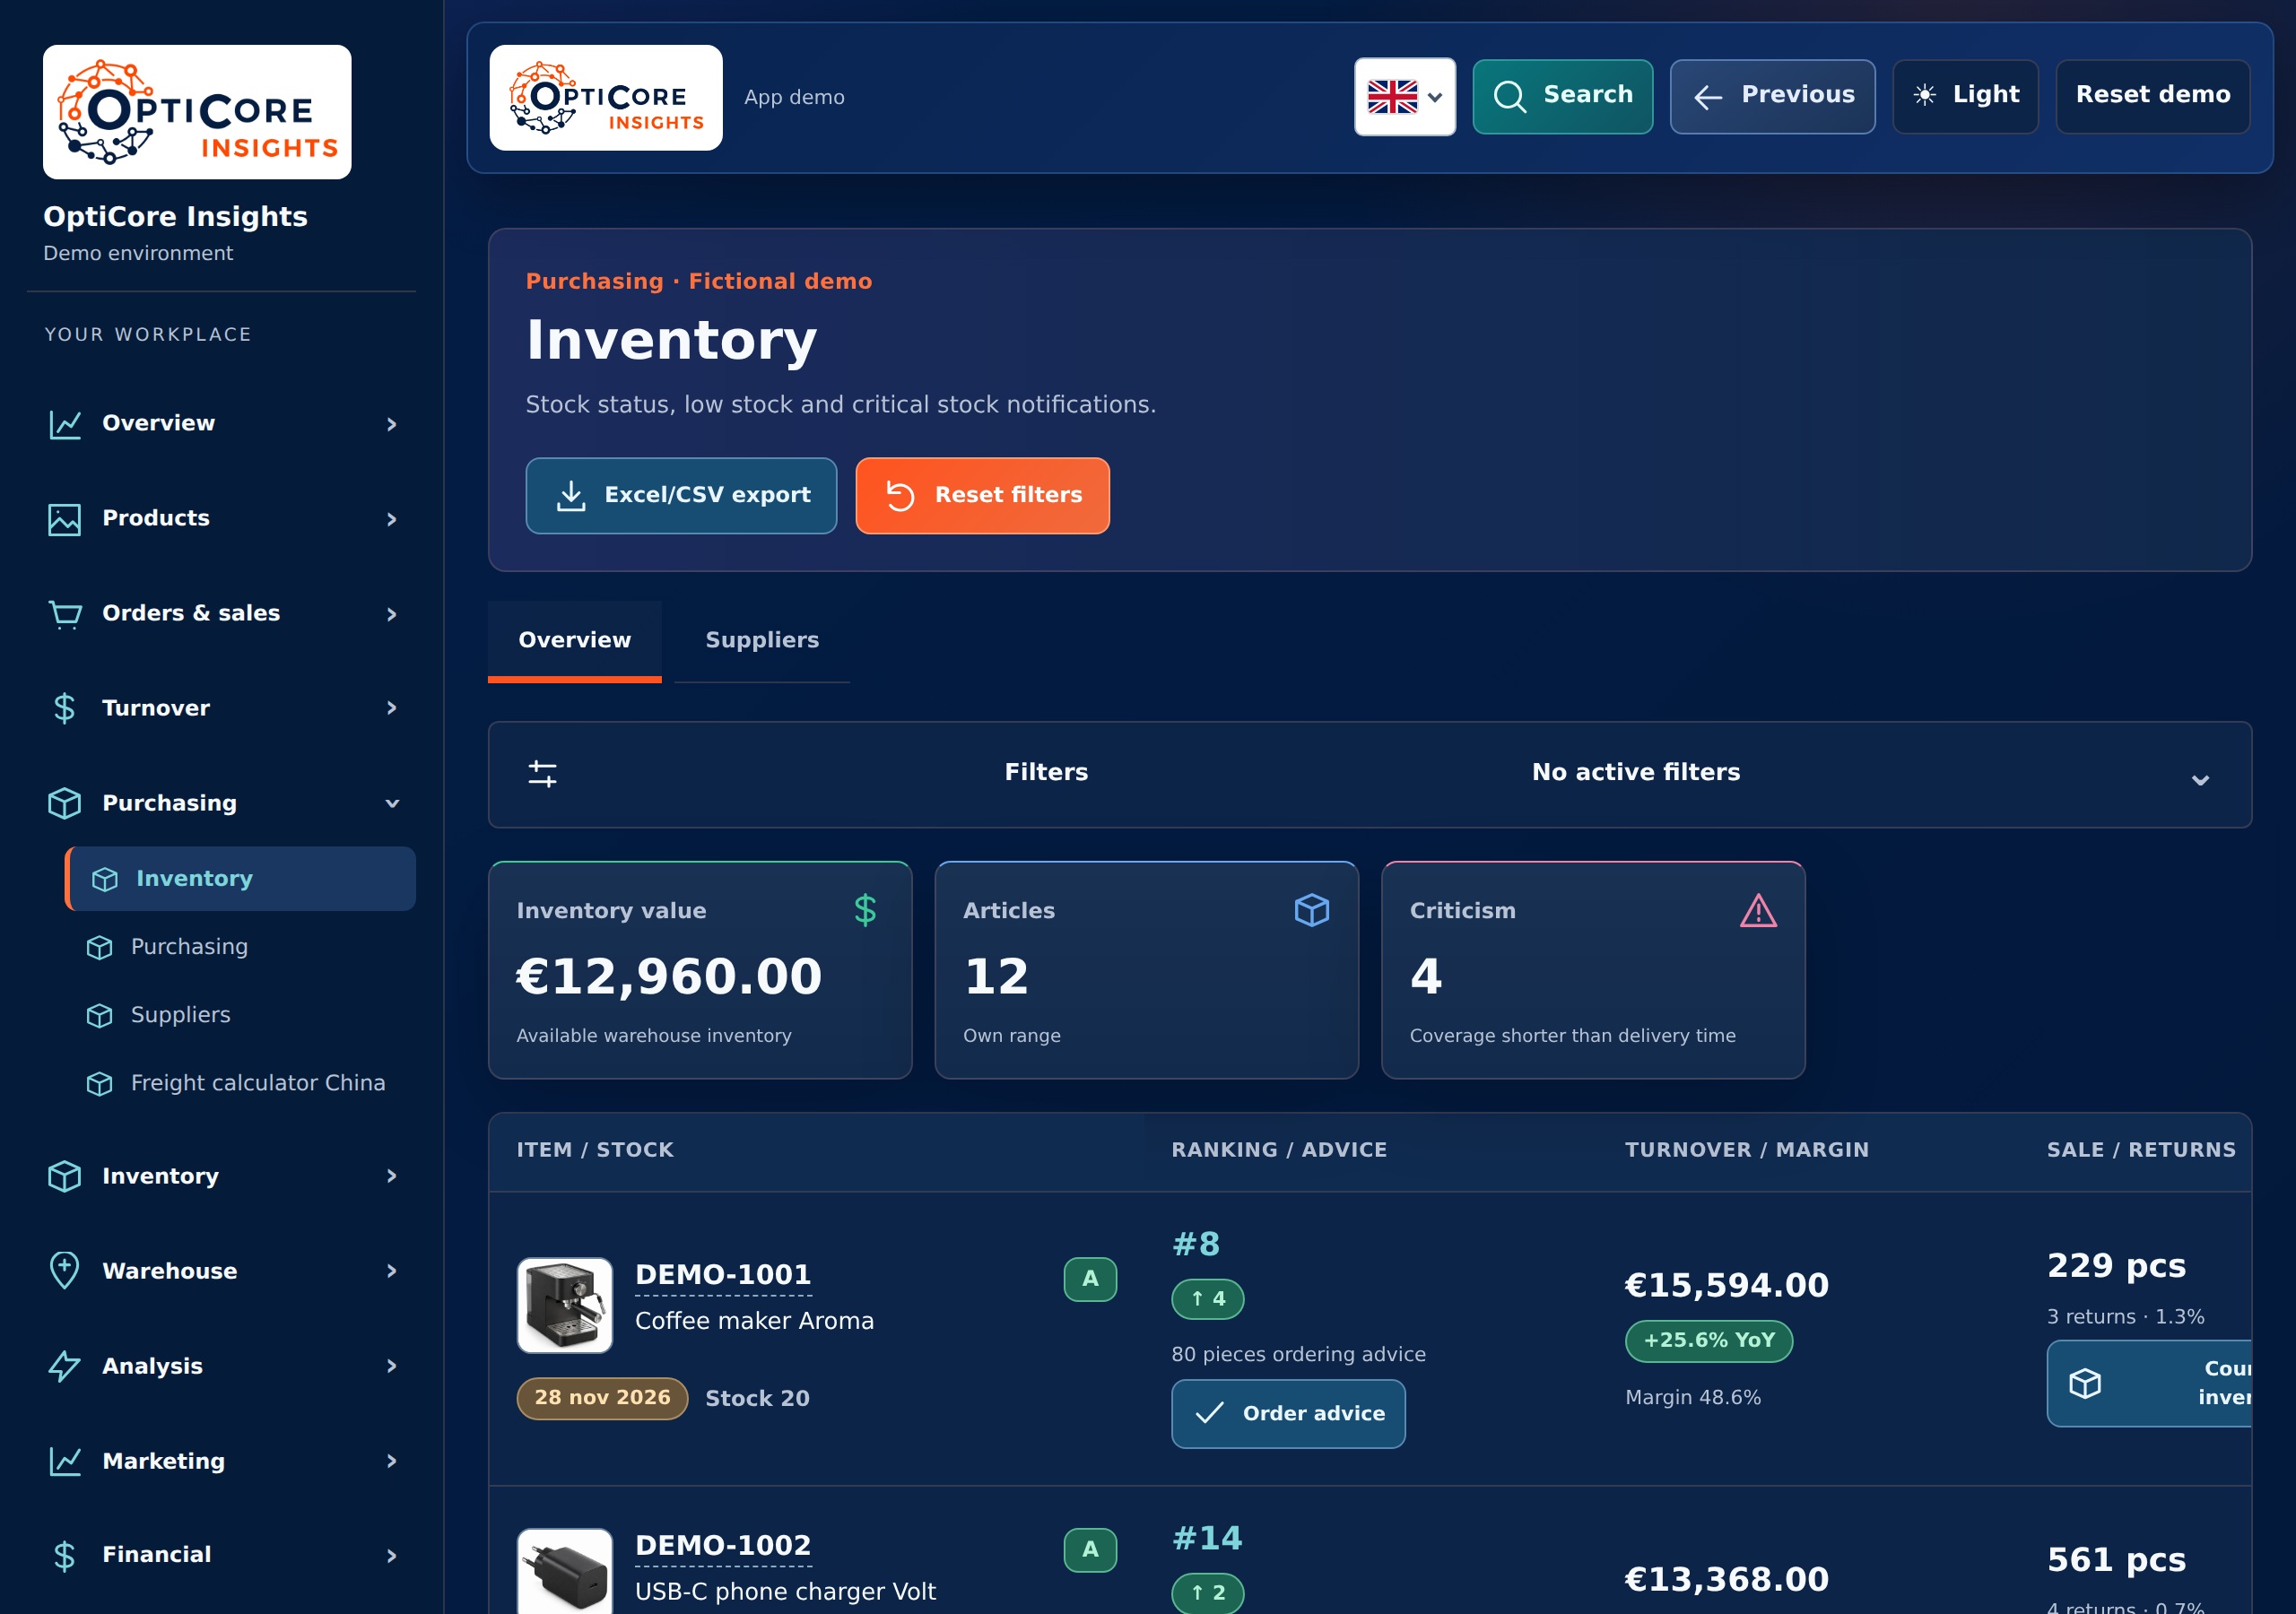
Reporting and automation require actionable source data. Checks reveal missing, duplicate or anomalous data.
An inventory analysis shows where items are running out, lying around for a long time or tying up a lot of money. Sales, delivery time and available stock together provide context.
Power BI brings together data from different sources in reports. You can compare figures per period, department or sales channel.
Tell us what you want to have made or what work currently takes a lot of time.
Please contact usOur approach
We make agreements easy to understand and keep you informed about progress, decisions and next steps.

We bring relevant figures together and explain what they mean, helping you decide where action is needed.

We look at which recurring steps could work smarter, with attention to checks, exceptions and the people using them.

We start with a clearly defined step. Then we expand with purpose, based on what your business and workflow need.